
click for the interactive version (requires WebGL-capable browser)
2014-03-15 17:10
If you are looking for a tool to easily create 3D visualizations of your geodata, look no further! Qgis2threejs is a plugin by Minoru Akagi which exports terrain data combined with the map canvas image and optional vector data to an html file which can be viewed in 3D in any web browser which supports WebGL. To do that, this plugin uses the Three.js library.
This is the result of my first experiments with Qgis2threejs. In the following sections, I will show the steps to reproduce it.
click for the interactive version (requires WebGL-capable browser)
The building blocks of this visualization are:
Load all datasets into QGIS.
Qgis2threejs will overlay the map (as rendered in the QGIS map area) on top of the elevation model. You can combine any number of layers to create your map. I just loaded a basemap.at WMTS and a hillshade layer. To add a nice tree shadow effect, I also added the tree layer (dark grey, 50% transparency, multiply blending).
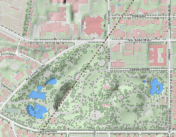
The vector features in the visualization are buildings and trees. The buildings are based on an OSM building layer. The trees are create from two point layers: one point layer to create the tree trunks (cylinder shape) and a duplicate of this point layer to create the tree crowns (sphere shape).
Load the data and choose the desired fill colors.
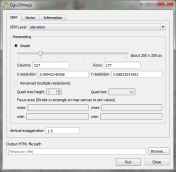
Now we can start Qgis2threejs. The first tab is used to configure the terrain. Just pick the correct elevation data layer. I didn’t modify any of the other default settings.
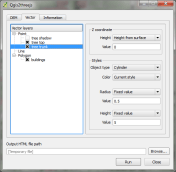
The second tab provides the settings for the vector data. As mentioned in the previous section, the trees are created from two point layers and the buildings are based on a polygon layer. The tree crowns are spheres with a radius size 3 and a z value of 5 above the surface. The tree trunks are cylinders. Finally, the buildings have a height of 10.
That’s it! Just press “run” and wait. When the export is finished, your default browser (or a different one, if you specify another one in the plugin settings) will open automatically and display the results.
The visualization is interactive. You can tilt the visualization using the left mouse button, pan using the right mouse button, and zoom using the mouse wheel. I found that Firefox used around 1.6 GB of RAM to render this example.
In the browser window, you will see where Qgis2threejs stored the html and associated Javascript files. To share your visualization, you just need to copy these files onto a webserver.
I would love to see what you come up with. Please share a link in the comments.
Posted by underdark
Categories: QGIS, Visualization
Mobile Site | Full Site
Get a free blog at WordPress.com Theme: WordPress Mobile Edition by Alex King.
Can you provide me the link of datasets used in this exercise or send these data layers on my email kanwar_1987@yahoo.co.in , so that i can try it on my system.
By vivek kanwar on 2014-03-16 at 10:28
All available datasets are linked under “1. The data”.
By underdark on 2014-03-16 at 11:30
How can I install this plugin? Thank you
By Antonina on 2014-03-17 at 17:26
Like any other plugin: just install in the plugin manager.
By underdark on 2014-03-17 at 19:04
Reblogged this on AJG-Develop.
By ajgdev on 2014-03-17 at 17:30
Everything is cool until the error messages start coming up. I’ll do some more exploration and post my take on the subject. Thanks Anita, this could be a great tool.
By horiapopa on 2014-03-17 at 18:20
Please report issues to the plugin author so they can be fixed. I also noticed some errors but couldn’t reproduce them a second time.
By underdark on 2014-03-17 at 19:06
Pretty cool stuff, I like it !
By kikislater on 2014-03-18 at 11:53
I can see potential on data analysis as well:
https://lh3.googleusercontent.com/-61n9CE9JBGk/U0gtU7qO-0I/AAAAAAAAFFA/HdRYiwNYTLs/w780-h425-no/ott.png
By J. Alary on 2014-04-11 at 19:00
If QGIS is closed, HTML file will not display content in browsers. Is it possible to display 3D content in html file without QGIS software???
By Hari Reddy on 2014-04-23 at 03:12
I cannot confirm this problem. If you click on the link to the interactive version in the post, the 3D content is display independent of whether you have QGIS running or not.
By underdark on 2014-04-23 at 19:02
Hi, Thankyou for reply. You are true., but my html file content is not displaying if i close QGIS. Is there any post processing is required to display the contents of html without QGIS?
By Hari Reddy on 2014-04-23 at 23:12
Great hint! This plugin is just awesome. Especially the latest update made it even more interesting.
I tried to use the plugin to visualize the relation between a non-DEM raster set and vector data. This is my outcome:
http://kartenmaler.blogspot.com/2014/04/liquid-wealth.html
I am still a little bit concerned whether I made any major mistakes in my assumptions.
By Gideon on 2014-05-07 at 07:53
Hi Gideon,
I really like your approach to this topic! Concerning the final visualization: For me, it feels like the elevation is a bit too exaggerated. It looks very jagged now. Also, when first looking at it, the visualization of the areas with little rain actually looked like rain clouds to me. So my initial interpretation – without reading the text – would have been exactly reversed.
By underdark on 2014-05-07 at 09:23
Thank you for the feedback! Now that you are mentioning it, I can only agree! I’ll put more attention about the reader’s interpretation in my next projects! Go on with your inspiring blog!
By Gideon on 2014-06-11 at 13:52
great plugin! it is so eay to handle it and generate a model. Thanks for the hint
By Olivier R. on 2014-05-07 at 09:24
I download a raster from srtm http://srtm.csi.cgiar.org/ but how I can render the raster in 3D without the elevation data (not provided from this website)? I reprojected the raster to the google projection (epsg:900913) and I created a raster hillshade from this reprojected raster.
By Olivier R. on 2014-05-26 at 11:48
Sorry, I finally found the elevation file in order to have the 3D vision here: http://dds.cr.usgs.gov/srtm/version2_1/SRTM3/Eurasia/
By Olivier R. on 2014-05-26 at 12:15
I finally did it with an orthophoto from the IGN (NAtional geographic french agency): http://img42.com/rcYuj
the location is in the Alpes Area.
By olivier on 2014-05-26 at 17:30
Nice work!
By underdark on 2014-05-26 at 19:25
Wow, this is great! Thanks a lot for sharing this!
By Cécile Nov on 2014-06-04 at 14:57
hi there — how did you create such nice edges on your model? mine looks very “tall”. i tried to adjust the vertical exaggeration but still couldn’t get rid of the tall “sides”. any ideas how to fix this? The “sides and frame options for the DEM don’t seem to do anything. i’m running QGIS Valmiera. http://neoninc.org/leah_test/3d/SJER_DSM_3d.html
By Leah on 2014-07-08 at 23:29
ok – i figured it out! it had to do with the map canvas size!! what a great plugin :)
By Leah on 2014-07-09 at 00:31
My first guess would be that the raster CRS is in degrees while your elevation values are in meters/miles. That would create jagged results if you use a z-factor of 1.
By underdark on 2014-07-09 at 07:56
My try.
A 3D map of a hiking trail in southern italy.
http://www.visitcaserta.0fees.us/Tifata.html
By Norrlandsson on 2014-09-05 at 16:38
My example using residential properties in Glasgow:
http://gisforthought.com/glasgow-3d-residential-property-density-qgis2threejs/
By heikkivesanto on 2014-11-13 at 14:12
Excuse my ignorance Anita, but specifically which “associated Javascript files” (to share the visualization copy these files onto a webserver.) The numeric titled .html and numeric .js OR CustomPlane.js etc?
Thanks from daniel
By daniel on 2014-12-11 at 20:30
For the example above, I uploaded a TrackballControls.js, three.min.js, and a js file with a name which looks like a timestamp.
By underdark on 2014-12-11 at 20:38
Thanks Anita!
-d
By daniel on 2014-12-12 at 01:46
Hi, Anita.
I’m trying to replicate the ArcScene behaviour with this pluggin and trying to overlay another raster surface (flow accumulation) over the dem. Arcscene layers can adjust all to a common dem using same ‘Base Heights’ parameter. But seems that you can’t use the same raster elevation for different dems.
Do you have an idea of how to?
For grass, where I did Flow accumulation with r.watershed didn’t efiind the Nviz complement.
Thanks, Ferran
By Ferran Ferrer on 2015-02-04 at 18:18
Can you provide an example? Do you want to drape the second raster over the DEM or do you want to add them up?
By underdark on 2015-02-04 at 18:50
Thanks for answering so fast.

Here is an example:
Exactly the dem is a roof and the raster draped over the dem is flow accumulation.
This is done using arcscene, I’m trying to replicate in Qgis.
By Ferran Ferrer on 2015-02-04 at 18:58
Other sample,

By Ferran Ferrer on 2015-02-04 at 18:59
To me, that looks exactly like the use case I presented in Publishing interactive web maps using QGIS: DEM + aerial image on top. So you want to put the flow accumulation raster instead of an aerial image? Just prepare the map of the flow accumulation layer, then configure the DEM in QGIS2threejs. Make sure that the display type “map canvas overlay” is enabled in the DEM settings.
Make sure that you are using the latest version of the plugin.
By underdark on 2015-02-04 at 19:08
You are right,

How can the settings reinitiate?
When I open again they shows the same layers and can’t delete it.
I can control through map display.
Thanks for the help!
By Ferran Ferrer on 2015-02-04 at 19:31
I don’t know about that. Maybe best to ask the plugin author.
By underdark on 2015-02-04 at 19:52
Before I do just thinking a little, not much, I found that is controled by QGis map canvas, if you eliminate a layer this disappear when you update, close and open again the pluggin in a Qgis map project.
Thanks again
By Ferran Ferrer on 2015-02-04 at 20:14
I have used ArcScene in the past, so I am also keen to recreate the behaviour I am familiar with. I can get a 3D image of raster overlaying a DEM [Landsat 7 on top of 1-arsecond SRTM for the UK] and it looks very nice. When I try to overlay a vector layer [such as rivers [lines] or World Heritage Sites (points)], I get ‘writing DEM’ and then ‘writing vector layer’, and the progress bar stays at 30% until it finally crashes. This happens even with simple shapefiles.
By Michael McBain on 2015-03-08 at 12:01
Overlaying vector layers works fine for me. Please get in touch with the plugin developer. The best approach usually is to open a ticket on the plugin bug tracker and include some test data to reproduce the issue.
By underdark on 2015-03-08 at 14:45
Hi, great post as always, thanks for helping access the great opportunities this plug in presents.
What has managed to elude me is point 5. I’ve put my output files on my server and pointed an iframe at the html and just get a blank frame.
Any chance of getting some more detailed advice on how to display the output on a blog?
By Boycey on 2015-03-08 at 12:18
I haven’t tried embedding the visualization in an iframe. You could ask on the QGIS user mailing list or on a web development forum.
By underdark on 2015-03-08 at 14:47