
MovingPandas is a Python library for handling movement data based on Pandas and GeoPandas. It provides trajectory data structures and functions for analysis and visualization.
Background
MovingPandas development started as a QGIS plugin idea in 2018. The resulting Trajectools plugin was first published in 2019. However, it became clear that the core trajectory handling classes should be extracted into in a separate library to make them usable outside the context of QGIS. This was the birth of MovingPandas.
In 2020, MovingPandas was approved for pyOpenSci.
The project
The MovingPandas repository contains multiple tutorials in the form of Jupyter notebooks that illustrate diverse analysis capabilities using different datasets, including: tracking data of ships, migration of birds, and tracks from a horse’s GPS collar.
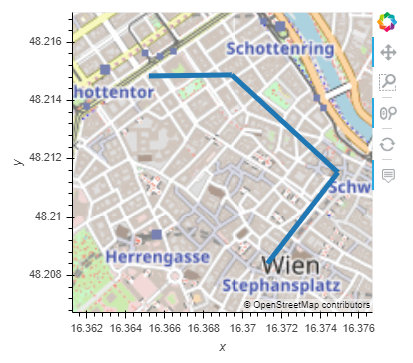
MovingPandas provides static plots using Matplotlib and interactive plots using hvplot
traj.hvplot(tiles='OSM', line_width=5, frame_width=300, frame_height=300)
Exploring Movement Characteristics
MovingPandas makes it straightforward to compute movement characteristics, such as trajectory length and duration, as well as movement speed and direction.
For example, we can explore the daily traveled distance as recorded by a GPS tracker:
df = read_file('tracker.gpkg')
tc = mpd.TrajectoryCollection(df, 'CollarID', t='t')

daily = tc.split_by_date(mode='day')
daily_lengths = [traj.get_length() for traj in daily.trajectories]
daily_t = [traj.get_start_time() for traj in daily.trajectories]
daily_lengths = pd.DataFrame(daily_lengths, index=daily_t, columns=['length'])
daily_lengths.hvplot(title='Daily trajectory length')
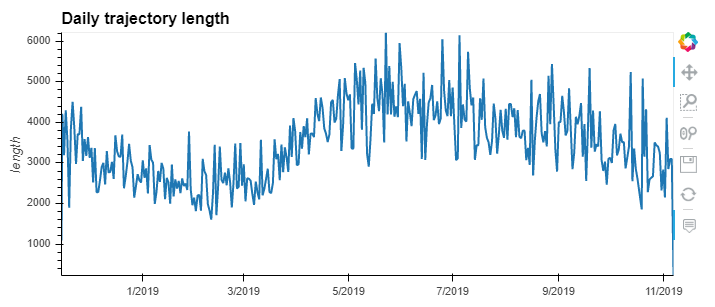
In this case, the movement data, which comes from a GPS collar of a horse, reveals that the animal tends to travel farther during summer days than during shorter winter days.
Other functions deal with trajectory generalization, splitting trajectories into subtrajectories, clipping trajectories to an area of interest, and extracting trajectory start and end times and locations.
Standing on the Shoulders of Giants
By leveraging existing functionality within the Python data analysis ecosystem, such as, for example: time series handling by Pandas, spatial data analysis by GeoPandas, and interactive plotting by HoloViews, MovingPandas can focus on its core functionality dealing with challenges that are specific to movement data.
For example, the close integration with HoloViews makes it possible to create interactive dashboards to explore the effect of different trajectory generalization methods:
What’s next?
MovingPandas is under active development and there are some exciting features coming up. If you’d like to contribute to this project, you’re welcome to head on over to the Github repo!
For more information, please visit http://movingpandas.org
