Aggregate all the things! (QGIS expression edition)
In the past, aggregating field values was reserved to databases, virtual layers, or dedicated plugins, but since QGIS 2.16, there is a way to compute aggregates directly in QGIS expressions. This means that we can compute sums, means, counts, minimum and maximum values and more!
Here’s a quick tutorial to get you started:
Load the airports from the QGIS sample dataset. We’ll use the elevation values in the ELEV field for the following examples:

QGIS sample airport dataset – categorized by USE attribute
The most straightforward expressions are those that only have one parameter: the name of the field that should be aggregated, for example:
mean(ELEV)

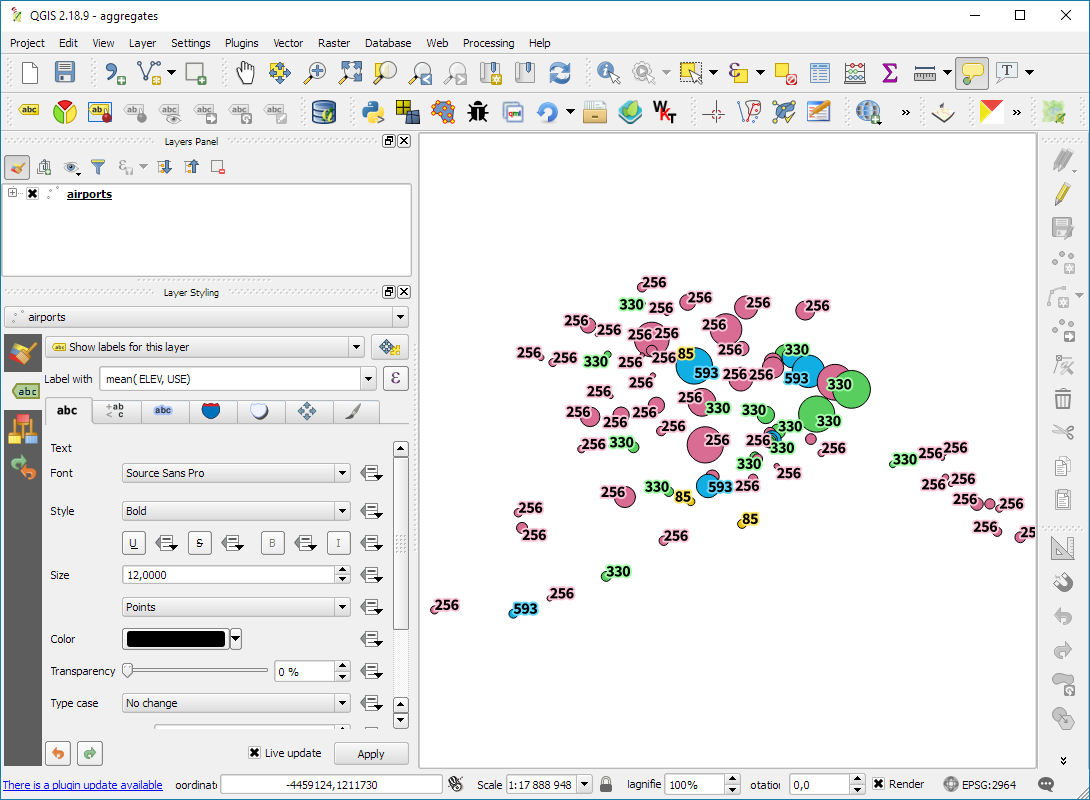
We can also add a second parameter: a group-by field, for example, to group by the airport usage type, we use:
mean(ELEV,USE)
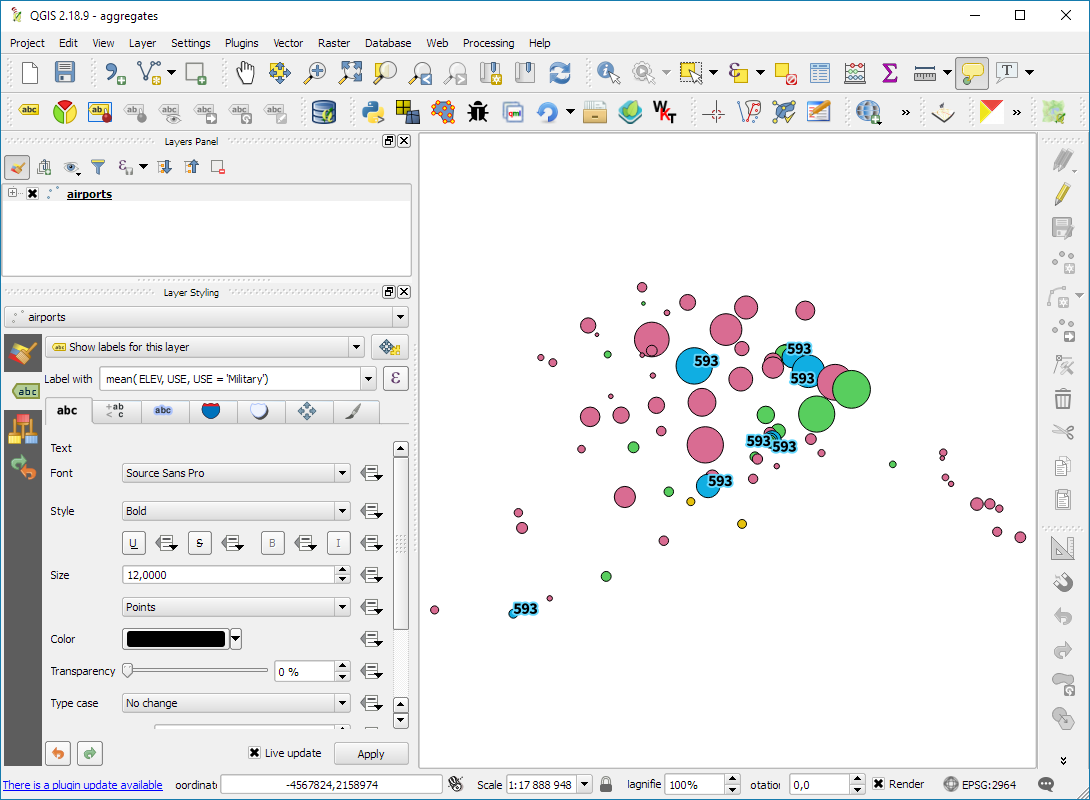
To top it all off, we can add a third parameter: a filter expression, for example, to show only military airports, we use:
mean(ELEV,USE,USE='Military')
Last but not least, all this aggregating goodness also works across layers! For example, here is the Alaska layer labeled with the airport layer feature count:
aggregate('airports','count',"ID")
 If you are using relations, you can even go one step further and calculate aggregates on feature relations.

What would be great is to be able to link this aggregation with the point cluster renderer by aggregating data by each cluster (ex: to aggregate the number of PT boardings for each point cluster)
Is it already possible or does it need an enhancement in point cluster renderer?
Is it possible to link aggregation with the new functionnality of point cluster render or does it need further developement? It would be great if aggregation could operate grouping by point cluster to show for example the number of PT boardings at stops with a point cluster map
Sounds like the functionality that is already implemented in 2.99 should be sufficient: https://anitagraser.com/cluster_renderer-gif/.
Nice post. Please note that the link https://anitagraser.com/cluster_renderer-gif/ points to a non-existing page.
Right should be https://underdark.files.wordpress.com/2017/06/cluster_renderer.gif
This may seem rather stupid but how did you get the expanding symbols based on elevation in the first place?
Using the size assistant mentioned in https://anitagraser.com/2015/06/21/qgis-2-10-symbology-feature-preview/
Thank you!
How did you symbolize two different attributes of the airports layer by both color (use) and size (elevation)? The only way I’ve been able to find is by rule-based symbolization. This may also be the way you did it, but I get the sense it’s not.
It’s a categorized renderer using a symbol with data defined size
Nice demo ! Side question: how do you get the labels to be the same color as the points ?
Thanks! To change the label buffer to the corresponding symbol’s color, set the label buffer’s expression to
@symbol_color.