Creating reports in QGIS3
QGIS 3 has a new feature: reports! In short, reports are the good old Altas feature on steroids.
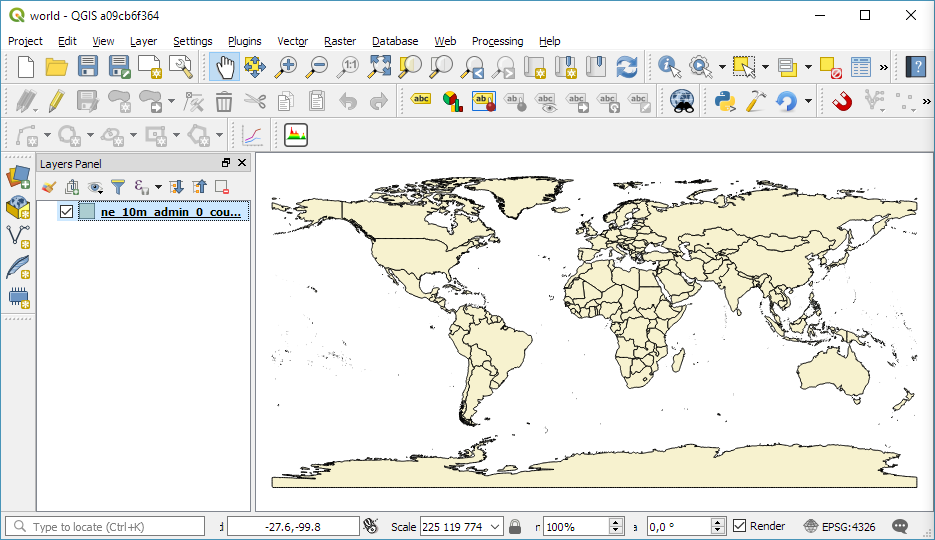
Let’s have a look at an example project:
To start a report, go to Project | New report. The report window is quite similar to what we’ve come to expect from Print Composer (now called Layouts). The most striking difference is the report panel at the left side of the screen.
When a new report is created, the center of the report window is empty. To get started, we need to select the report entry in the panel on the left. By selecting the report entry, we get access to the Include report header and Include report footer checkboxes. For example, pressing the Edit button next to the Include report header option makes it possible to design the front page (or pages) of the report:

Similarly, pressing Edit next to the Include report footer option enables us to design the final pages of our report.
Now for the content! We can populate our report with content by clicking on the plus button to add a report section or a “field group”. A field group is basically an Atlas. For example, here I’ve added a field group that creates one page for each country in the Natural Earth countries layer that I have loaded in my project:

Note that in the right panel you can see that the Controlled by report option is activated for the map item. (This is equivalent to a basic Atlas setup in QGIS 2.x.)
With this setup, we are ready to export our report. Report | Export Report as PDF creates a 257 page document:

As configured, the pages are ordered by country name. This way, for example, Australia ends up on page 17.
Of course, it’s possible to add more details to the individual pages. In this example, I’ve added an overview map in Robinson projection (to illustrate again that it is now possible to mix different CRS on a map).

Happy QGIS mapping!

This is a great tool for QGIS, and it has potential to be even greater.
– Import pre-built PDF as sections (re-use cover pages, or include other reports)
– Rich text element widget (useful also in Layouts)
– And the same text styling as in labeling in the map
These are just some ideas popping up when trying out QGIS Reports. I guess the more people start using QGIS 3, the more suggestions for improvements will emerge… Don’t get me wrong, QGIS 3 is great, but it also presents a lot of new possibilities.
True, I think we rarely have the issue of too few new feature ideas.
Sounds to me like ‘reports’ are strictly for maps?
Although this is a great new feature, it would be awesome if users could include data tables and plotly visuals from your other post in reports. So, if you had population data by age range and country, there would be a histogram that updates for each new page.
So far, there are maps, tables, images, and text items that can be integrated. Diagrams would certainly be a good addition. Check out https://anitagraser.com/2016/10/15/qgis-atlas-tutorial-material-design/ for an example of how to create diagrams with currently available functionality.