Exploring Vienna’s street-level Lidar “Kappazunder” data sample
Kappazunder is the city of Vienna’s database created during their recent mobile mapping campaign. Using vehicle-mounted Lidar and cameras, they collected street-level Lidar and street view images.
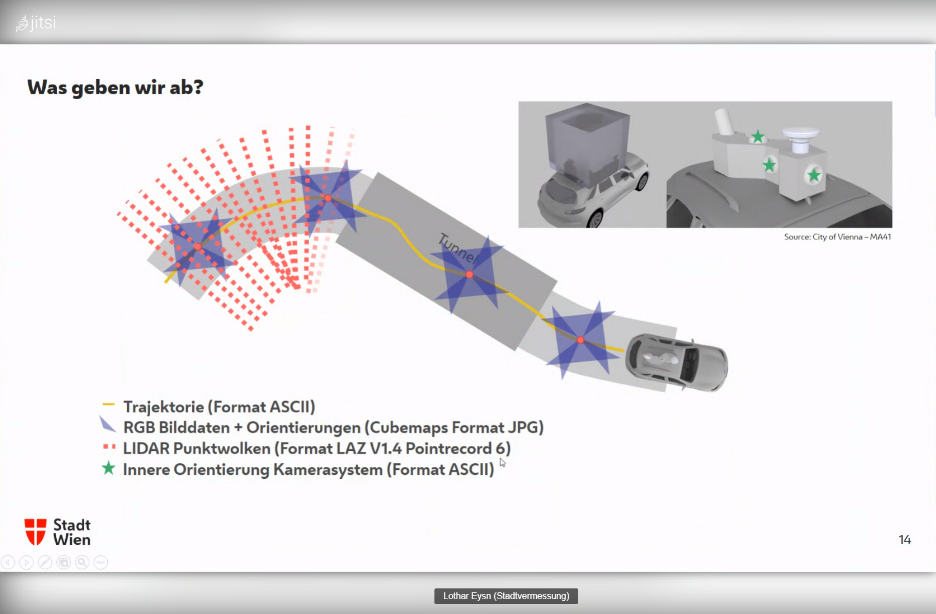
Yesterday, they published a first sample dataset, containing one trajectory on data.gv.at. The download contains documentation, vector data (.shp), images (.jpg), and point clouds (.laz):

Trajectory

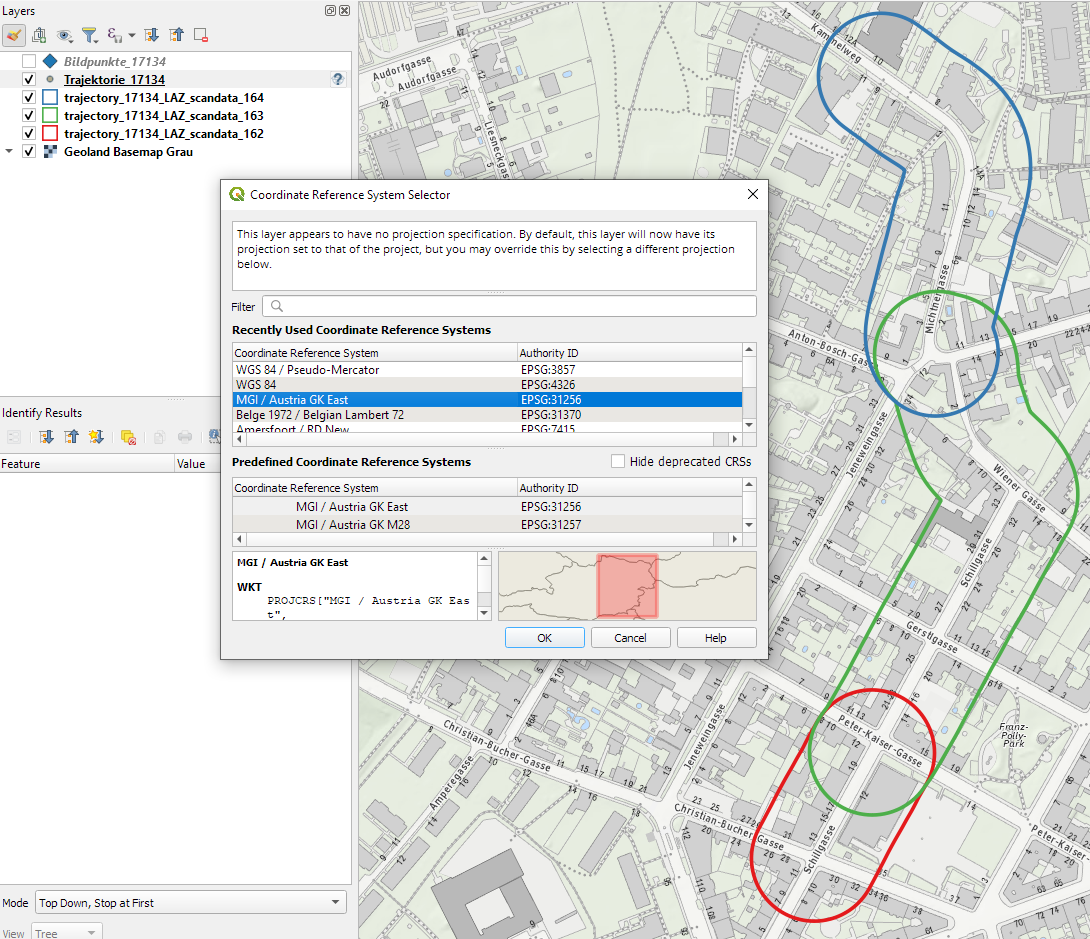
The shapefiles contain vehicle location updates, photo locations, and areas describing the extent of the point clouds. Since the shapefile lack .prj files, we need to manually specify the correct CRS (EPSG:31256 MGI / Austria GK East).
The vehicle location updates and photo locations contain timestamps as epoch. However, the format is a little special:
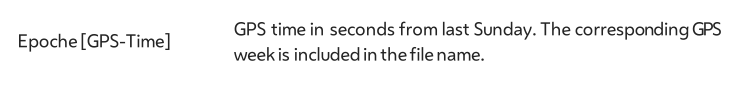
To display a human-readable timestamp, I therefore used the following label expression:
format_date( datetime_from_epoch( "epoch_s"*1000), 'HH:mm:ss')
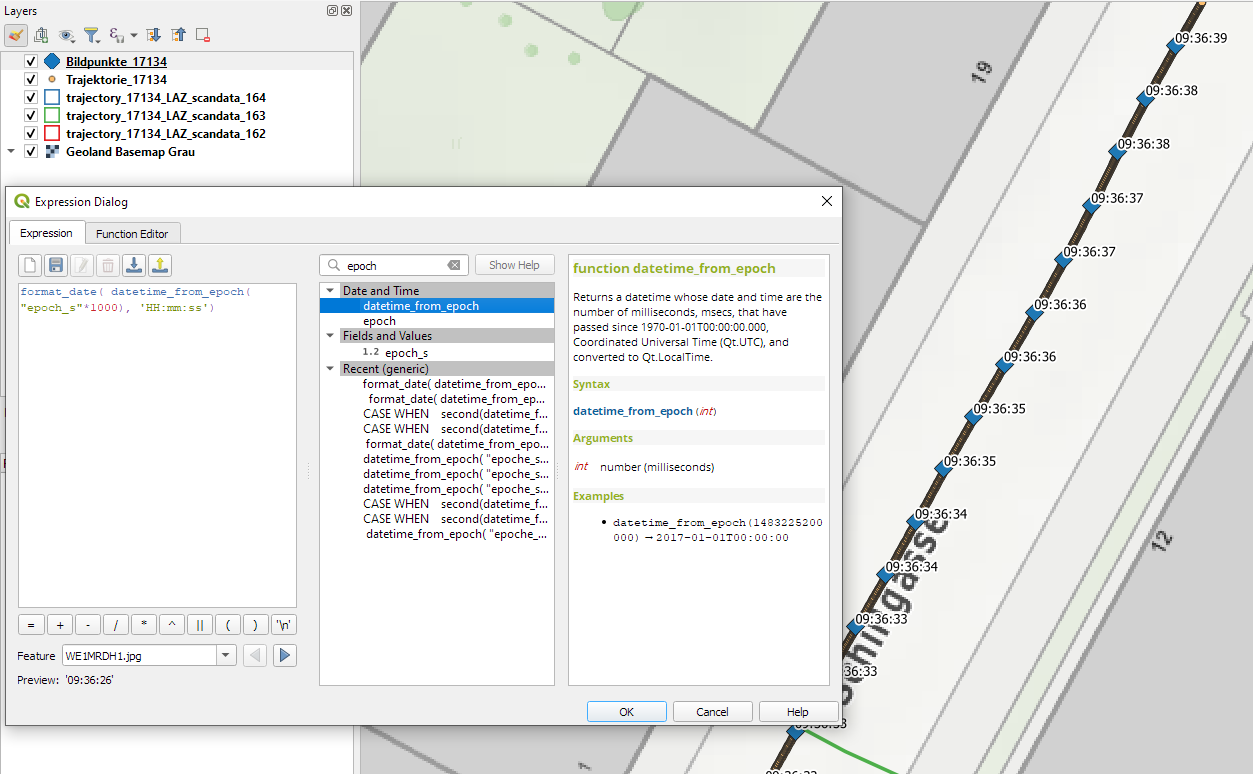
Adding these labels also reveals that the whole trajectory is just 2 minutes long. This puts the download size of over 5GB into perspective. The whole dataset will be massive.
Lidar
The .laz files are between 100 and 200MB, each. There are four .laz files, even though the previously loaded point cloud extent areas only suggested three:

Loading the .laz files for the first time takes a while and there seem to be some issues – either on the user end (me) or in the files themselves. Trying to load content of the ept_ folders only results in very few points and multiple “invalid data source” errors:

For the few point that are loaded, it looks like the height information is available:
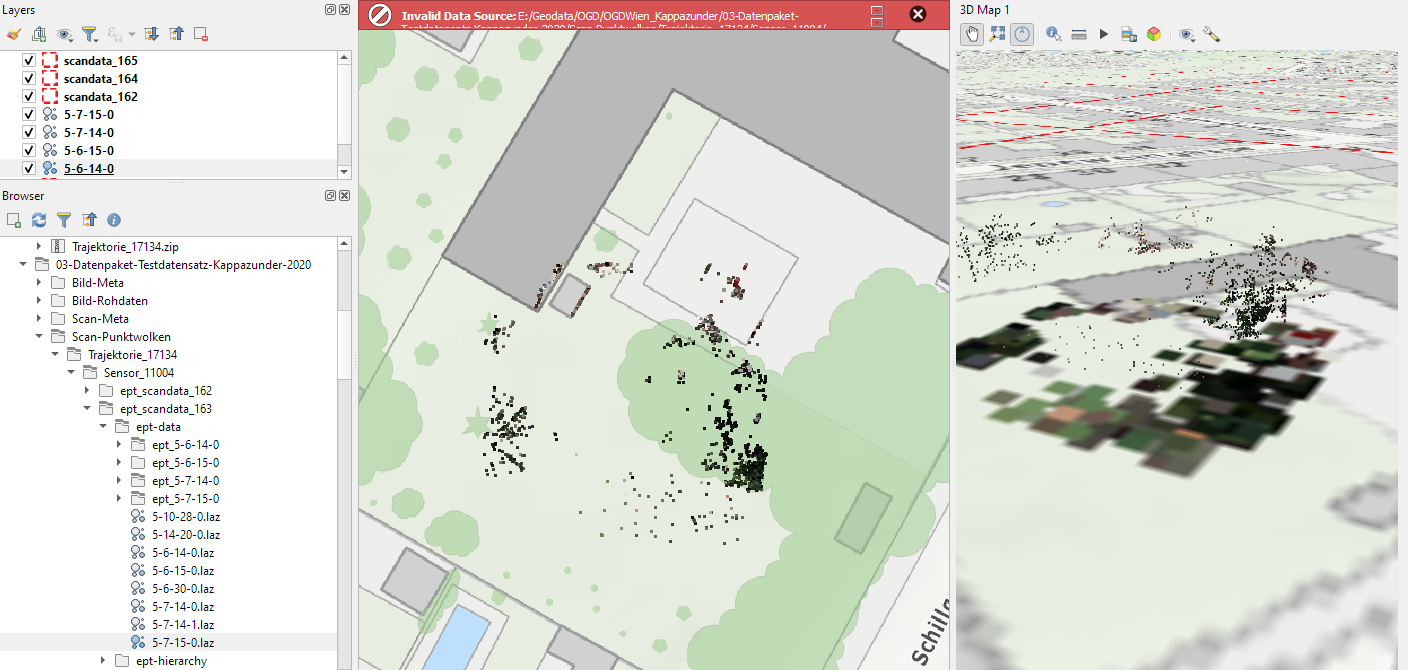
Update on 2021-10-01: I’ve reported the data loss issue and Martin Dobias has provided a first work-around that makes it possible to view the data in QGIS:
Images
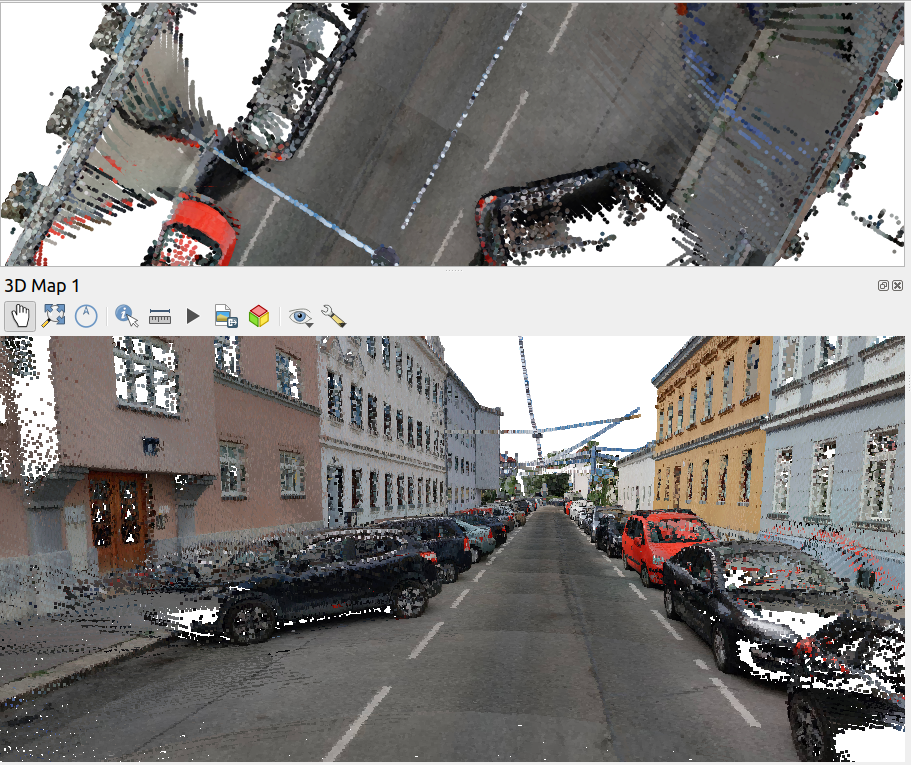
The street view images are published as cubemaps. Here’s a sample of the side view:


Hi Anita, and thanks for the first look on this amazing dataset!
Concerning the laser scan data: Upon loading the .laz into QGIS, they are being converted to the ept format (the “ept-scandata” folders don’t exist before that). After fully converting them, there seems to be quite a loss of data, the ept-files are much to small to contain all points, and also none of the attributes are shown in QGIS. Opening the laz-Files in other software (e.g. CloudCompare) shows nice, RGB-colored laser scans. The files are also valid LAZ according to lastools. Maybe worth contacting the QGIS devs to see if this is an issue with the importer?
– Lukas
Thanks for looking into this, Lukas! I’ll see what I can find out.
Update: here’s the ticket https://github.com/qgis/QGIS/issues/45307
Awesome, thanks for the ticket, and the data in QGIS looks really nice :)
Interesting, thanks for sharing it!. I wonder if the data loss could be handled by other means, other algorithms for example. Of course, in this case, the source provided you the information, but what to do in the cases where we can’t get it?.
My understanding is that there’s an upstream bug that needs to be fixed and then the point clouds should be displayed just fine. If other laz sources experience other issues, that needs to be looked at on a case-by-case basis.