Archive

GIS

This year, the QGIS community is not writing their wish lists to Santa Claus. This year, we get to send our wishes to kCube!

You will find the wish list on the QGIS Wiki. The page is aimed at collecting ideas for features and tasks that can be assigned to the 6 months of developer time being donated by kCube Consulting. Later, there will be a poll to find the most useful contributions.

Have your say and post your ideas! And don’t hesitate to follow kCube’s example ;)
I used to go to batchgeo.com for geocoding address lists, but last time I visited, I couldn’t find where to download the resulting list with lat/lon values.

Luckily, there’s another service available that will do: GPSVisualizer.com. They offer several options for geocoding: single address, address list, and a service for tabular data. Like batchgeo.com, they use Yahoo’s geocoding API to do the actual work.

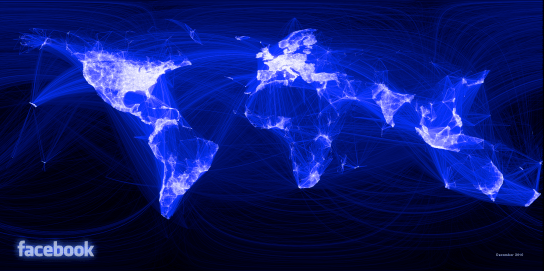
Paul Butler, an intern at facebook, has created a map of facebook relationships. Relationships are represented by great circle arcs connecting the locations of two friends. The result is a great looking map of the relationships on facebook:

Interesting (… but scary)!

Vincos from vincosblog has compiled a series of world maps showcasing the distribution of different social networks worldwide and the changes over the last 18 months. The maps clearly show facebook taking over :
World Map of Social Networks

The “1st Conference on Spatial Statistics 2011” is going to take place from 23rd – 25th of March 2011 at the University of Twente, Enschede, The Netherlands. Topics include:

  • Mapping global change
  • Spatial and spatio-temporal statistical methodology
  • Environmental issues
  • Ecological and habitat changes
  • Health and epidemiology
  • Economy and energy
  • Image use and analysis
  • Developing countries

http://www.sethoscope.net hosts a really neat Python script for heatmap creation.

The script takes data points with latitude and longitude coordinates (list of points or a GPX track log) and plots them on a map so areas where points are dense show brightly.

Nice extras include: GPX tracks can be rendered as line segments instead of disconnected points. You can generate animations using ffmpeg. The heatmaps can be put on top of OpenStreetMap tiles.

The script is released under AGPL making it free to improve and share.

Interesting news from the gispython.org community mailing list: There is a new Python library out there called PyKML.

PyKML allows parsing and authoring of KML documents based on the lxml.objectify API which provides Pythonic access to XML documents.

Nathan from woostuff.wordpress.com has compiled a descriptive comparison of MapInfo and QGIS. He presents the up and downsides of QGIS compared to one of the major commercial GIS around. 

The QGIS community presents two new case studies:

QGIS and GRASS applied to paleontological survey in Western Portugal by André Mano
QGIS as major GIS software in the Laboratory on Experimental and Applied Geography by Jakub Trojan

GeoServer has always been good at simply publishing database tables. But anything more complex (e.g. pre-filtering data in a table, joining two tables together, or generating values on the fly) could be painful. With Geoserver 2.1 one can finally create a layer directly from an SQL query.

"Create New SQL View" interface

Even dynamic queries are possible, e.g.

select gid, state_name, the_geom from pgstates where persons between %low% and %high%

To select for example all states with 2 to 5 millions inhabitants, the following parameters can be added to the normal GetMap request:

&viewparams=low:2000000;high:5000000

Find more information on SQL layers in Geoserver 2.1 documentation.