Profile Tool tutorial
Profile Tool is a plugin for QGIS which makes it possible to generate (elevation) profiles for line features. The plugin is available through the default QGIS plugin repository. While testing the plugin, I found some aspects of using the tool might require additional instructions.
After installing and enabling the plugin, you will find the “Terrain profile” button in the plugin toolbar:
The basic use case is as follows:
- Load the elevation raster and select this raster layer in the layer list.
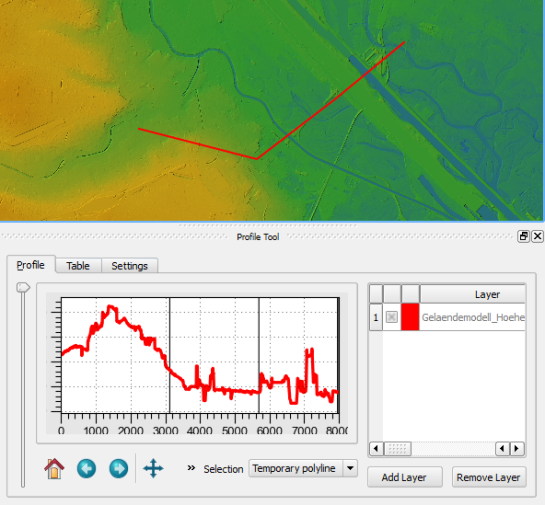
- Press the “Terrain profile” button. This opens the plugin panel which consists of a graph area on the left and a raster layer list on the right. The raster layer you had selected will be added to the raster layer list.
- If you have “Selection: Temporary polyline” enabled, you can now draw a line in the map area. Double-click left to end drawing the line. (If you are paying close attention, you might have noticed the instructions in the status bar.)
- After you have finished drawing the line, the graph area will update and display the profile.
If you want to add another raster layer to the plugin, you need to first select the raster layer in the QGIS layer list and then press the “Add Layer” button in the Profile Tool panel.
To generate the profile for an existing line feature, you need to change the selection mode from “Temporary polyline” to “Selected polyline”. Then you need to select the vector layer which contains the line feature you want to use in the QGIS layer list. Finally, you can click on the line feature in the map area to select it. (Note that this selection is independent of any selections you might have going on using the default QGIS feature selection tools.)
If you change from the Profile Tool to any other tool such as “Pan Map” or “Identify”, you have to click the “Terrain profile” button again to re-enable drawing/selection a line for the Profile Tool.
Due to a bug, it is currently not possible to export the profile graph. An alternative is to open the “Table” tab of the Profile Tool panel which provides access to the profile data and copy the data into your preferred graphing application such as Calc or Excel.
If you want to see the Profile Tool in action, I recommend watching the introduction video by Lene Fischer (University of Copenhagen).


Anita, is there also a way to show y-data in the graph?
If the panel/window is wider, the y-axis labels become visible. The GUI could certainly use some more love.
Hello Anita, congratulations for the post. Here I managed to export the graphic profile. At first it seemed a box stating the error, but then I realized that it was sufficient to select the raster files related to the profile that the export worked smoothly. Sorry for english
Interesting! I don’t even get the “save” button (working with OSGeo4W right now). Seems to depend on the installed packages.
Anita plot which library are you using? With matplotlib can not export the profiles, only using Qwt5. These options are in the settings tab.
The dropdown list in options only lists matplotlib on my OSGeo4W installation.
If I use matplotlib directly form QGIS console, I get a save button.
from matplotlib import pyplotpyplot.plot([1,2,3],[4,6,5])
pyplot.show()
The Statist plugin uses matplotlib as well and it does have a save button … That’s a bit confusing.
Hi Anita
Thanks for this tutorial.
The profile tool is great. We also use it to see treeheights. One of my assignments is to take the surfacemodel and the terrain model in the rastercalculator diffe (minus) to get the height. And combining with the profile tool, the students can “see” the trees from another “angle”-
You can see it in this video : http://screencast.com/t/WixfhiAe0b
Regards
Lene Fischer
University of Copenhagen
Hi Lene,
Very nice video! If you don’t mind, I would like to put a link to it into the blog post above.
Best wishes,
Anita
Most welcome. :-)
Lene
I’ve always had a bit of an issue with the profile tool.
Due to the nature of the DEM-raster data I have, locations which are known to have buildings have been ‘cut out’ of the LIDAR point data, so in the 5×5 raster version that was based on that data, there are ‘nodata’ values (gml files).
NGI (national agency) supplies a tool to convert it to geotiff’s, and replace nodata by zero.
Doing so, when creating a color ramp, I always color the zero values in black. However, if you use the profile tool, and one of the pixels happens to be a ‘nodata’ or ‘0’ value, then entire profile is hard to read due to it including the zero value, which obviously doesn’t do the scale ont he y-as any good.
Is there a known workaround for this?
In my opinion, the profile tool should not interpret ‘nodata’ values as 0. If it does that, I recommend filing a bug report.
Another approach might be to fill the holes of the DEM using interpolation but I have not tried that yet.
Pingback: Tutorial del plugin Profile Tool di QGIS | openoikos
Hi Anita,
Thanks for this tutorial over profile tool;
I have one query regarding the same. During the profile generation of a line feature over any DEM raster, I need to identify the locations of the profile peaks of that line feature.
Do we have such kind of option in the profile tool so that we can trace the location also along with profile?
Thanks,
Prince
Hi Prince,
I’m currently not aware of any such function. One idea would be to contact the plugin author. You could also go a different way and extract points from the line feature which you then use to sample the raster. In the resulting point file with elevation attributes, you could identify the highest peak.