Interactive plots for GeoPandas GeoDataFrames of LineStrings
GeoPandas makes it easy to create basic visualizations of GeoDataFrames:
However, if we want interactive plots, we need additional libraries. Folium (which is built on Leaflet) is a great option. However, all examples for plotting GeoDataFrames that I found focused on point or polygon data. So here is what I found to work for GeoDataFrames of LineStrings:
First, some imports:
import pandas as pd
import geopandas
import folium
Loading the data:
graph = geopandas.read_file('data/population_test-routes-geom.csv')
graph.crs = {'init' :'epsg:4326'}
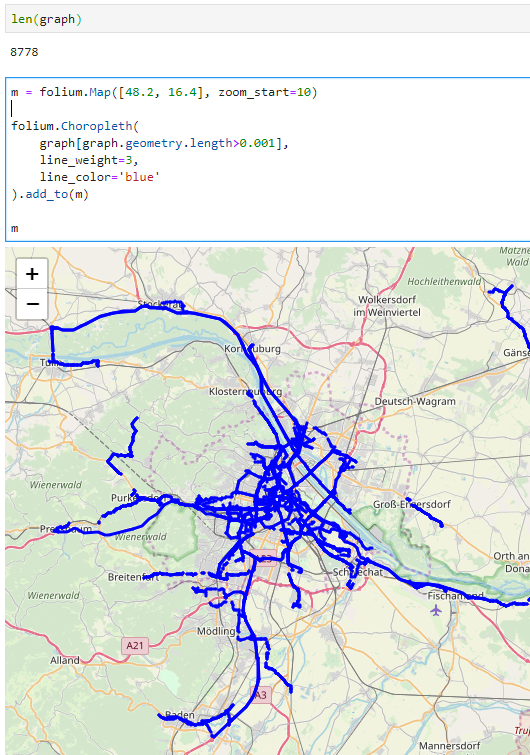
Creating the map using folium.Choropleth:
m = folium.Map([48.2, 16.4], zoom_start=10)

folium.Choropleth(
    graph[graph.geometry.length>0.001],
    line_weight=3,
    line_color='blue'
).add_to(m)

m
I also tried using folium.PolyLine which seemed like the more obvious choice but does not seem to accept GeoDataFrames as input. Instead, it expects a list of coordinate pairs and of course it expects them to be in the opposite order that Shapely.LineString.coords provides … Oh the joys of geodata!
In any case, I had to limit the number of features that get plotted because Folium refuses to plot all 8778 features at once. I decided to filter by line length because drawing really short lines is pointless for my overview visualization anyway.


When your data has a lot more detail/resolution than you can plot, aggregating before plotting can really speed things up. Something like Datashader can do it, even on-the-fly, based on the extent and zoom of your “viewport”.
When working in a notebook, the ipyleaflet library is also nice for quickly visualizing spatial data. It will probably suffer similar to Folium if the amount of data gets large.
Thanks for sharing, Rutger!