Archive

Author Archives: underdark

QGIS 2.2 is now available for Windows through OSGeo4W installer. Packages for other systems are being prepared by the package maintainers.

The Windows packages are currently marked experimental, so you have to use the advanced install in OSGeo4W and check the ‘Exp’ radio button on the top to install them.

osgeo4w_qgis22

As release manager Jürgen Fischer announced:

Please test and report problems, so that I can soon promote them to ‘curr’ent.
Once that has happend, I’ll proceed with turning them into standalone
installers.

QGIS 2.2 will be released tomorrow, February 21st. Following the release of 2.0, the QGIS project decided to move to a time-based release plan with releases every four months. This provides a clear framework for developers, translators and documenters which makes it possible to plan ahead and know when tasks have to be finished to be included in a release version.

Similar to the 2.0 release, the project has invested considerable resources to make 2.2 “Valmiera” a successful release. I have already blogged about some of the great new features. Thanks to the project donors and sponsors it was also possible to fund developer time for many important bug fixes.

One of the greatest resources of the QGIS project are its users. One group that deserves our special thanks is the Swiss QGIS User Group. They collect a modest annual membership fee which provides a steady and growing crowd-funding that can be used to positively influence the QGIS project. For example, they invested in bug fixing for 2.0 and they are co-funding work on multi-threaded rendering for QGIS 2.4.

With the rise of new QGIS user groups “QUGs” all around the world, e.g. in Australia, the UK, and the US, I hope these groups will find ways to bring users together and to positively influence the development of QGIS towards the next releases.

This weekend, I had the pleasure to join Tim Sutton for the second edition of the QGIS Podcast. Every episode, the podcast aims to summarize the latest mailing list discussions and greatest new features.
This episode’s topics include: new CAD tools, usability and the new UX mailing list, new QGIS user groups (QUGs), point cloud support plans, and QGIS design.

If you would like to ask a question or suggest a topic, you can write to podcast@qgis.org.

If you want to become an active part of this year’s FOSS4G, it’s now time to start thinking about your contributions!

FOSS4G 2014 will be taking place in Portland, Oregon, USA from Sept 8th-12th. Like last year in Nottingham, there will be a regular track for presentations as well as an academic track and a series of workshops.

logo_horiz_500x231

If you are looking for inspiration, you might want the check out last year’s programme or read about the interesting story behind this years conference logo.

With the major release of version 2.0, QGIS is once more returning to a fast release cycle. You can find the project road map on qgis.org. The QGIS 2.2 release is scheduled for Feb, 21st and we are already in feature freeze. This means that now is the time to get the nightly version, do some testing and report possible bugs before the new version is being shipped.

Like for version 2.0, the QGIS team has prepared a great visual change log listing many new features. For me, one of the feature highlights is the possibility to export maps with world files from Print Composer because it means that we can finally create high-resolution, georeferenced images comfortably from within the application.

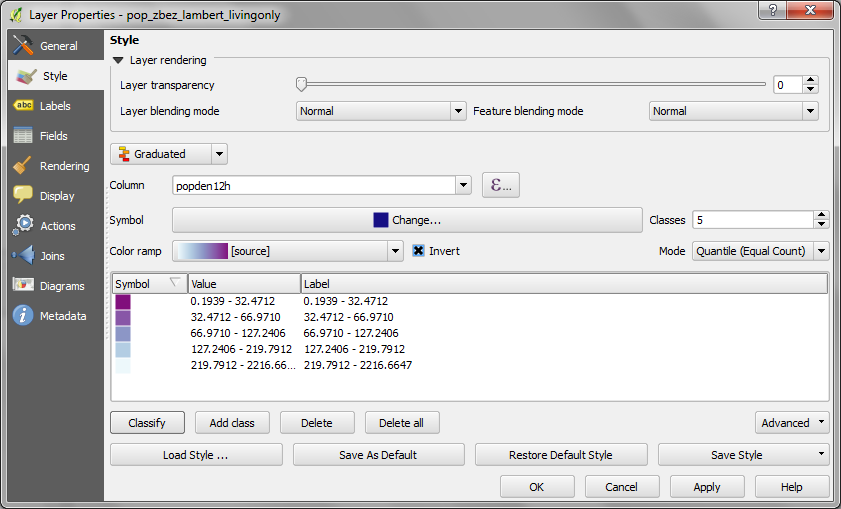
Another feature which will help save a lot of time is the ability to invert color ramps. So far, we had to recreate the color ramp or use work-arounds involving expression-based color settings to achieve the same effect.

invertcolorramp

These are just my personal favorites. If you haven’t checked out the change log yet, I certainly encourage you to have a look and decide for yourself. Also, if you find the time, please help by testing and reporting any issues you encounter. This way, we can all help to make 2.2 another successful release.

and thank you for a great 2013!

It has been a very busy year between writing my first book, going to FOSS4G, writing my first journal article and continuing to write this blog. The blog view counter shows a staggering 310,000 views for 2013.

The most popular posts of 2013 were:

  1. pgRouting 2.0 for Windows quick guide
  2. Vintage map design using QGIS
  3. Group Stats tutorial
  4. the Print Composer 2.0 series
  5. and Public transport isochrones with pgRouting

All the best for 2014!

OSM place search and osmSearch are two plugins for QGIS which use the Nominatim service to find addresses and places. They are both still marked as “experimental” plugins, so users are expected to expect the unexpected.

Once installed, both plugins look very similar: There is an input text field and a results list.

osmsearch_giefinggasse

A simple search with street name and house number returns the expected results. Interacting with the result shows some differences:

  • OSM place search will highlight the location when you mouse-over the result in the list. On double-click, it will zoom to the result.
  • osmSearch will highlight the result and move the map center to the result if you double-click but won’t zoom.

Both plugins can deal with umlauts (ä,ö,ü) but only osmSearch works with háčeks.

osmsearch_hacek

A nice feature of osmSearch is that it remembers your previous searches and offers an auto-complete function.

OSM place search on the other hand offers a reverse “Where am I” function (the arrow pointing to the left” which tries to find a name for the current map center location. Additionally, there are functions to add the current object as a new layer or mask layer.

Both plugins have strong and weak points. Combined, they would make a really strong tool but then nothing prevents us from having them both and choosing the best one for the task at hand.

Profile Tool is a plugin for QGIS which makes it possible to generate (elevation) profiles for line features. The plugin is available through the default QGIS plugin repository. While testing the plugin, I found some aspects of using the tool might require additional instructions.

After installing and enabling the plugin, you will find the “Terrain profile” button in the plugin toolbar:

qgisprofiletool

The basic use case is as follows:

  1. Load the elevation raster and select this raster layer in the layer list.
  2. Press the “Terrain profile” button. This opens the plugin panel which consists of a graph area on the left and a raster layer list on the right. The raster layer you had selected will be added to the raster layer list.
  3. If you have “Selection: Temporary polyline” enabled, you can now draw a line in the map area. Double-click left to end drawing the line. (If you are paying close attention, you might have noticed the instructions in the status bar.)
  4. After you have finished drawing the line, the graph area will update and display the profile.

qgisprofiletool2

If you want to add another raster layer to the plugin, you need to first select the raster layer in the QGIS layer list and then press the “Add Layer” button in the Profile Tool panel.

To generate the profile for an existing line feature, you need to change the selection mode from “Temporary polyline” to “Selected polyline”. Then you need to select the vector layer which contains the line feature you want to use in the QGIS layer list. Finally, you can click on the line feature in the map area to select it. (Note that this selection is independent of any selections you might have going on using the default QGIS feature selection tools.)

If you change from the Profile Tool to any other tool such as “Pan Map” or “Identify”, you have to click the “Terrain profile” button again to re-enable drawing/selection a line for the Profile Tool.

Due to a bug, it is currently not possible to export the profile graph. An alternative is to open the “Table” tab of the Profile Tool panel which provides access to the profile data and copy the data into your preferred graphing application such as Calc or Excel.

If you want to see the Profile Tool in action, I recommend watching the introduction video by Lene Fischer (University of Copenhagen).

Since I finally managed to download the elevation model of the city of Vienna, I thought I’d share some eye candy with you: The map uses layer blending to combine hillshade and elevation raster, and the elevation raster’s color ramp is a modified “garish14” from QGIS’ cpt-city color ramp collection.

wien_elevation by underdarkGIS
wien_elevation, a photo by underdarkGIS on Flickr.

Update

Here is how you get access to the “garish14” color ramp:

Start by selecting the "new color ramp" option in the raster's style window.

Start by selecting the “new color ramp” option in the raster’s style window.

Chose the "cpt-city" color ramp type.

Chose the “cpt-city” color ramp type.

In the "cpt-city color ramp" window, you will find lots of different premade color ramps. "garish14" is part of the "Topography" collection.

In the “cpt-city color ramp” window, you will find lots of different premade color ramps. “garish14” is part of the “Topography” collection.

In my previous post, I presented a Processing model to determine positional accuracy of street networks. Today, I’ll cover another very popular tool to assess OSM quality in a region: network length comparison. Here’s the corresponding slide from my FOSS4G presentation which shows an example of this approach applied to OSM and OS data in the UK:

foss4g_osm_data_quality_12

One building block of this tool is the Total graph length model which calculates the length of a network within specified regions. Like the model for positional accuracy, this model includes reprojection steps to ensure all layers are in the same CRS before the actual geoprocessing starts:

total_graph_length

The final Compare total graph length model combines two instances of “Total graph length” whose results are then joined to eventually calculate the length difference (lenDIFF).

compare_total_graph_length

As usual, you can find the models on Github. If you have any questions, don’t hesitate to ask in the comments and if you find any issues please report them on Github.