This is a guest post by Chris Kohler @Chriskohler8.
Introduction:
This guide provides step-by-step instructions to produce drive-time isochrones using a single vector shapefile. The method described here involves building a routing network using a single vector shapefile of your roads data within a Virtual Box. Furthermore, the network is built by creating start and end nodes (source and target nodes) on each road segment. We will use Postgresql, with PostGIS and Pgrouting extensions, as our database. Please consider this type of routing to be fair, regarding accuracy, as the routing algorithms are based off the nodes locations and not specific addresses. I am currently working on an improved workflow to have site address points serve as nodes to optimize results. One of the many benefits of this workflow is no financial cost to produce (outside collecting your roads data). I will provide instructions for creating, and using your virtual machine within this guide.
Steps:–Getting Virtual Box(begin)–
Intro 1. Download/Install Oracle VM(https://www.virtualbox.org/wiki/Downloads)
Intro 2. Start the download/install OSGeo-Live 11(https://live.osgeo.org/en/overview/overview.html).
Pictures used in this workflow will show 10.5, though version 11 can be applied similarly. Make sure you download the version: osgeo-live-11-amd64.iso. If you have trouble finding it, here is the direct link to the download (https://sourceforge.net/projects/osgeo-live/files/10.5/osgeo-live-10.5-amd64.iso/download)
Intro 3. Ready for virtual machine creation: We will utilize the downloaded OSGeo-Live 11 suite with a virtual machine we create to begin our workflow. The steps to create your virtual machine are listed below. Also, here are steps from an earlier workshop with additional details with setting up your virtual machine with osgeo live(http://workshop.pgrouting.org/2.2.10/en/chapters/installation.html).
1. Create Virutal Machine: In this step we begin creating the virtual machine housing our database.
Open Oracle VM VirtualBox Manager and select “New” located at the top left of the window.

Then fill out name, operating system, memory, etc. to create your first VM.

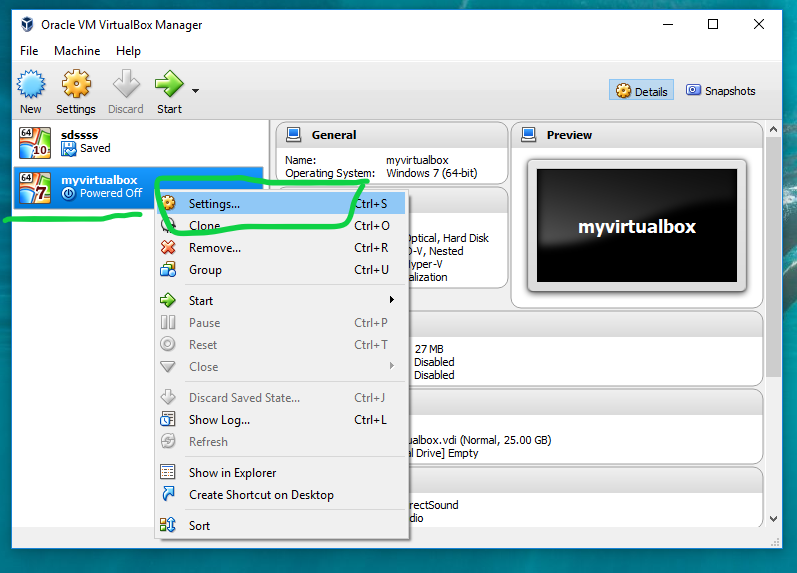
2. Add IDE Controller: The purpose of this step is to create a placeholder for the osgeo 11 suite to be implemented. In the virtual box main window, right-click your newly-created vm and open the settings.
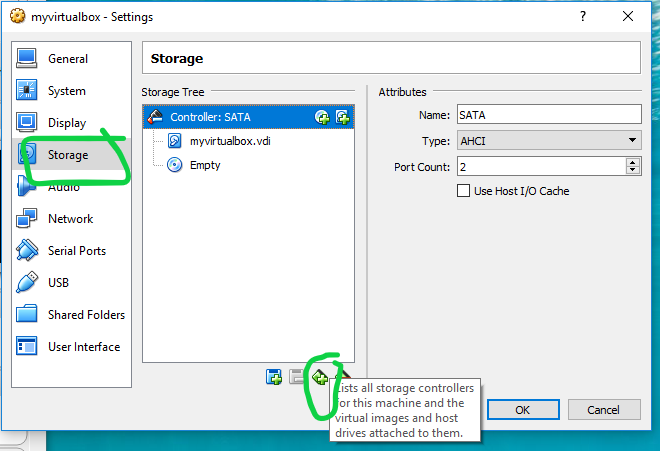
In the settings window, on the left side select the storage tab.
Find “adds new storage controller” button located at the bottom of the tab. Be careful of other buttons labeled “adds new storage attachment”! Select “adds new storage controller” button and a drop-down menu will appear. From the top of the drop-down select “Add IDE Controller”.
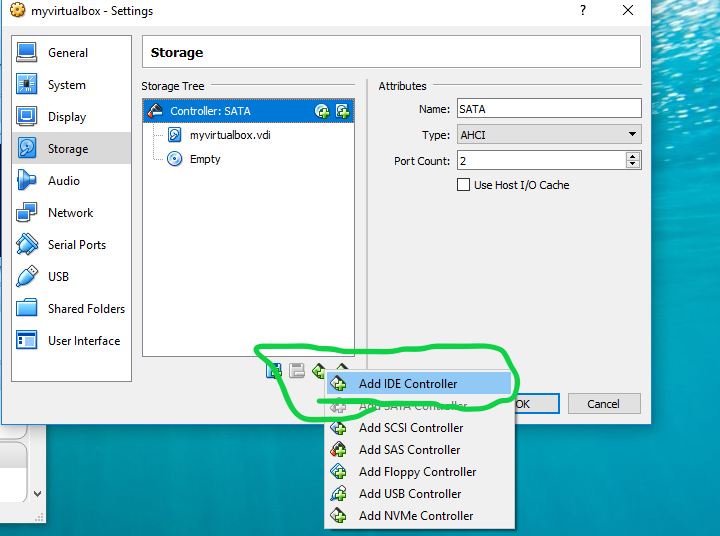
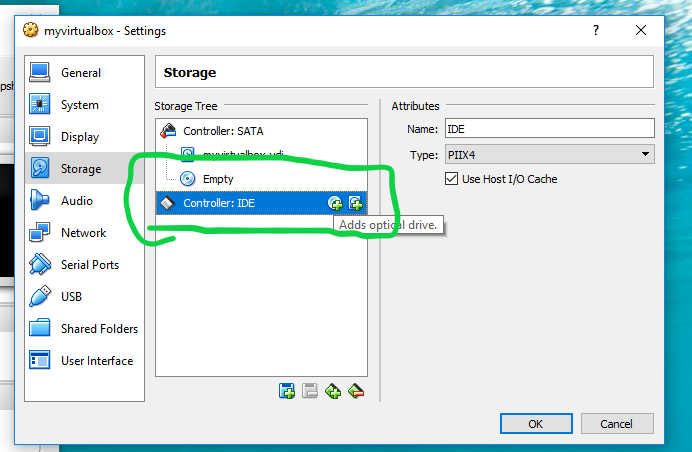
You will see a new item appear in the center of the window under the “Storage Tree”.
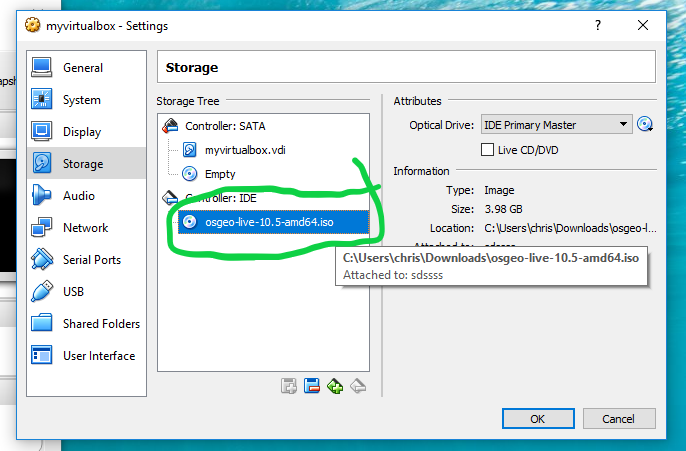
3. Add Optical Drive: The osgeo 11 suite will be implemented into the virtual machine via an optical drive. Highlight the new controller IDE you created and select “add optical drive”.
A new window will pop-up and select “Choose Disk”.

Locate your downloaded file “osgeo-live 11 amd64.iso” and click open. A new object should appear in the middle window under your new controller displaying “osgeo-live-11.0-amd64.iso”.
Finally your virtual machine is ready for use.
Start your new Virtual Box, then wait and follow the onscreen prompts to begin using your virtual machine.

–Getting Virtual Box(end)—
4. Creating the routing database, and both extensions (postgis, pgrouting): The database we create and both extensions we add will provide the functions capable of producing isochrones.
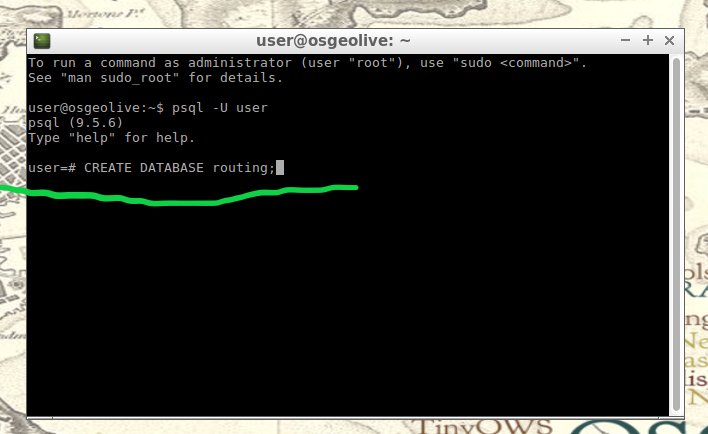
To begin, start by opening the command line tool (hold control+left-alt+T) then log in to postgresql by typing “psql -U user;” into the command line and then press Enter. For the purpose of clear instruction I will refer to database name in this guide as “routing”, feel free to choose your own database name. Please input the command, seen in the figure below, to create the database:
CREATE DATABASE routing;
You can use “\c routing” to connect to the database after creation.
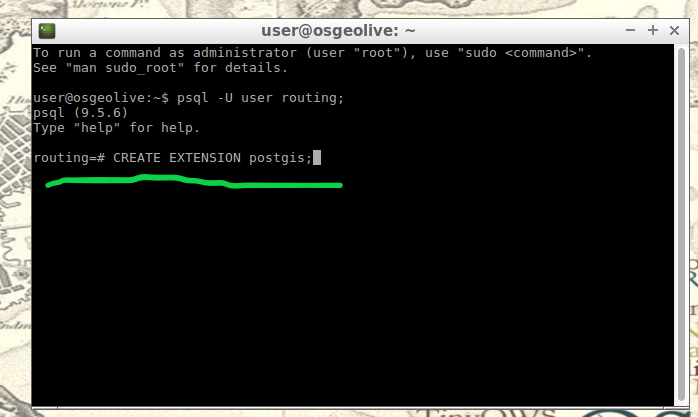
The next step after creating and connecting to your new database is to create both extensions. I find it easier to take two-birds-with-one-stone typing “psql -U user routing;” this will simultaneously log you into postgresql and your routing database.
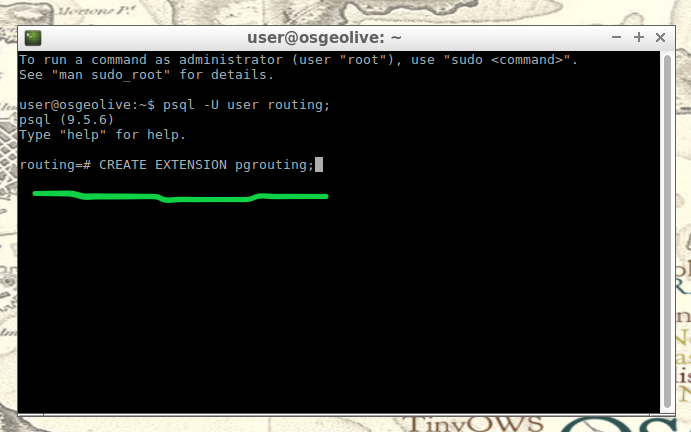
When your logged into your database, apply the commands below to add both extensions
CREATE EXTENSION postgis;
CREATE EXTENSION pgrouting;
5. Load shapefile to database: In this next step, the shapefile of your roads data must be placed into your virtual machine and further into your database.
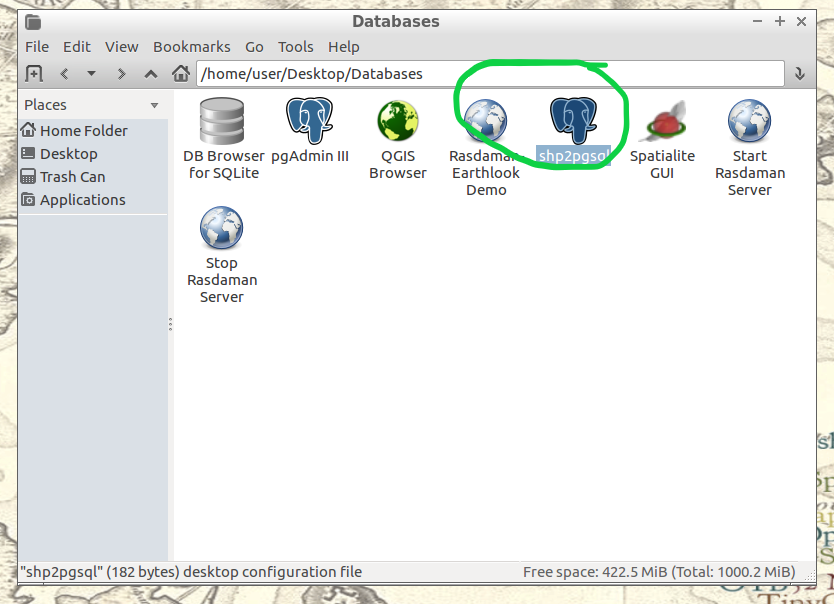
My method is using email to send myself the roads shapefile then download and copy it from within my virtual machines web browser. From the desktop of your Virtual Machine, open the folder named “Databases” and select the application “shape2pgsql”.
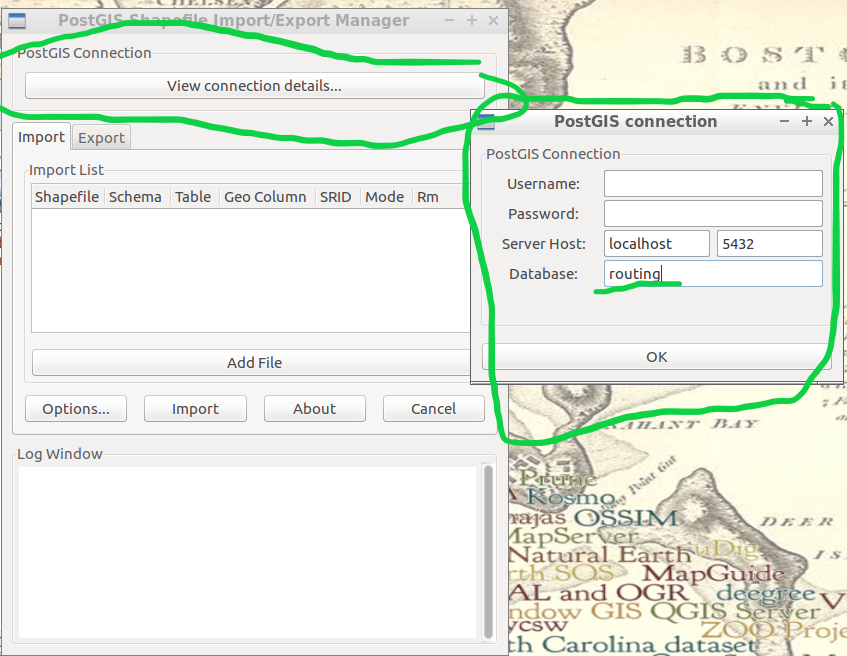
Follow the UI of shp2pgsql to connect to your routing database you created in Step 4.
Next, select “Add File” and find your roads shapefile (in this guide we will call our shapefile “roads_table”) you want to use for your isochrones and click Open.
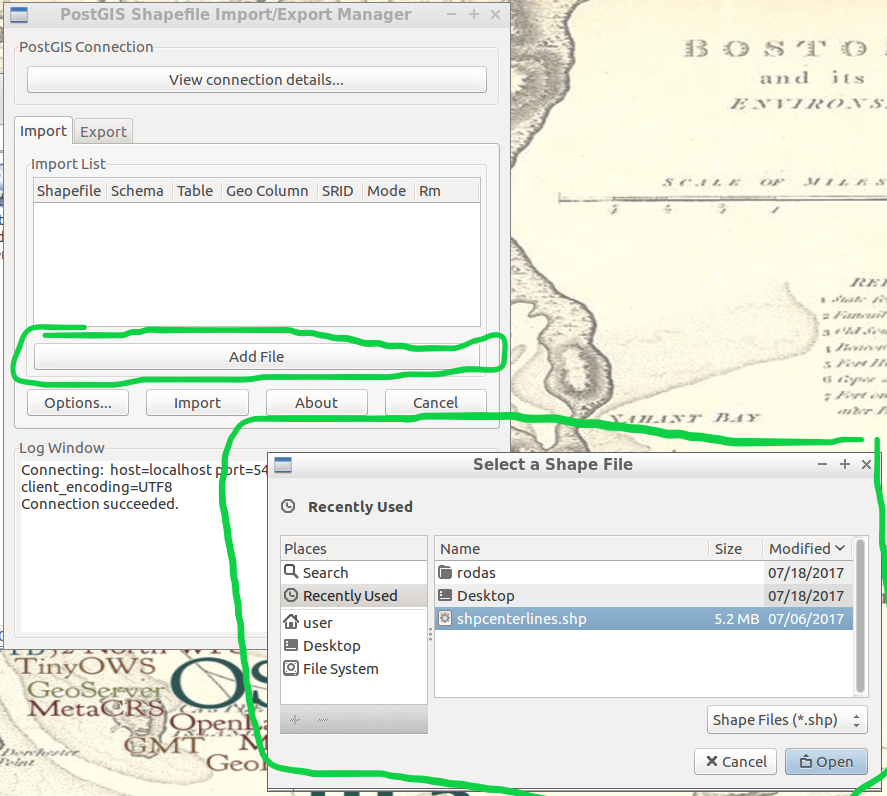
Finally, click “Import” to place your shapefile into your routing database.
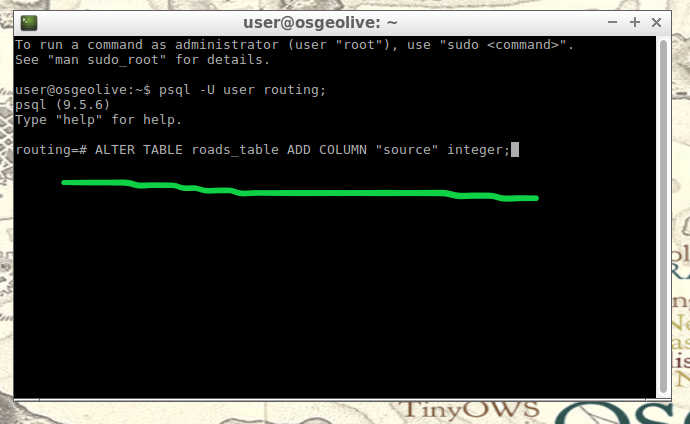
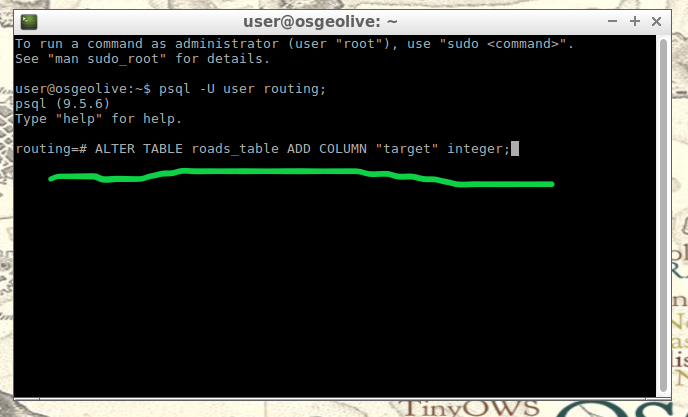
6. Add source & target columns: The purpose of this step is to create columns which will serve as placeholders for our nodes data we create later.
There are multiple ways to add these columns into the roads_table. The most important part of this step is which table you choose to edit, the names of the columns you create, and the format of the columns. Take time to ensure the source & target columns are integer format. Below are the commands used in your command line for these functions.
ALTER TABLE roads_table ADD COLUMN "source" integer;
ALTER TABLE roads_table ADD COLUMN "target" integer;
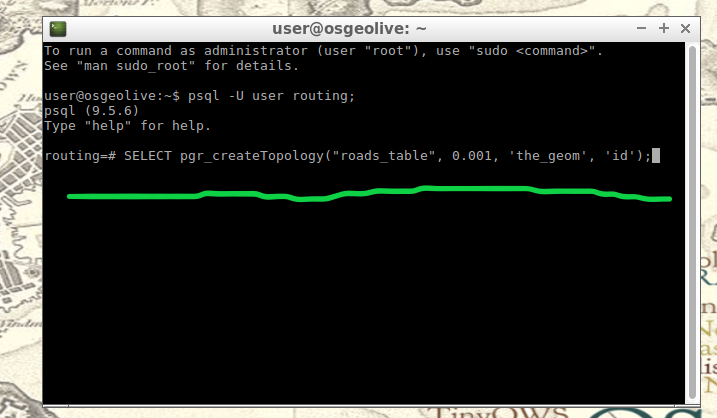
7. Create topology: Next, we will use a function to attach a node to each end of every road segment in the roads_table. The function in this step will create these nodes. These newly-created nodes will be stored in the source and target columns we created earlier in step 6.
As well as creating nodes, this function will also create a new table which will contain all these nodes. The suffix “_vertices_pgr” is added to the name of your shapefile to create this new table. For example, using our guide’s shapefile name , “roads_table”, the nodes table will be named accordingly: roads_table_vertices_pgr. However, we will not use the new table created from this function (roads_table_vertices_pgr). Below is the function, and a second simplified version, to be used in the command line for populating our source and target columns, in other words creating our network topology. Note the input format, the “geom” column in my case was called “the_geom” within my shapefile:
pgr_createTopology('roads_table', 0.001, 'geom', 'id',
 'source', 'target', rows_where := 'true', clean := f)
Here is a direct link for more information on this function: http://docs.pgrouting.org/2.3/en/src/topology/doc/pgr_createTopology.html#pgr-create-topology
Below is an example(simplified) function for my roads shapefile:
SELECT pgr_createTopology('roads_table', 0.001, 'the_geom', 'id')
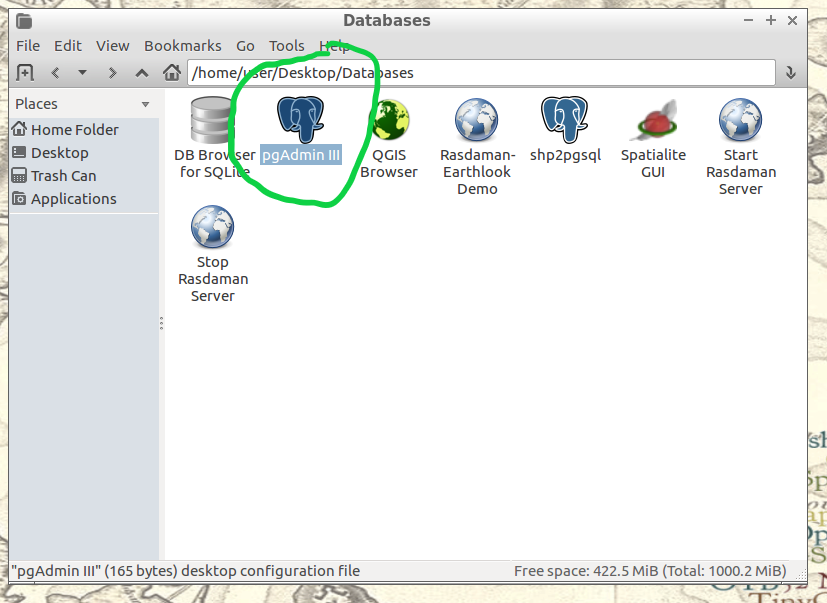
8. Create a second nodes table: A second nodes table will be created for later use. This second node table will contain the node data generated from pgr_createtopology function and be named “node”. Below is the command function for this process. Fill in your appropriate source and target fields following the manner seen in the command below, as well as your shapefile name.
To begin, find the folder on the Virtual Machines desktop named “Databases” and open the program “pgAdmin lll” located within.
Connect to your routing database in pgAdmin window. Then highlight your routing database, and find “SQL” tool at the top of the pgAdmin window. The tool resembles a small magnifying glass.
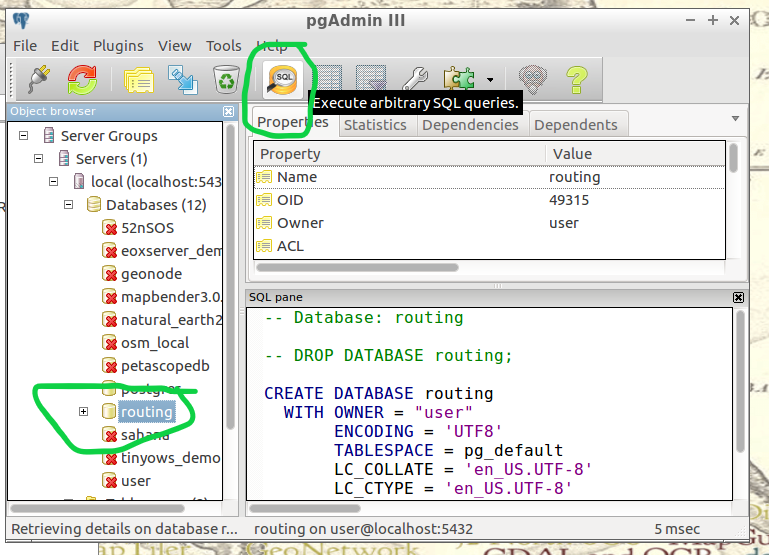
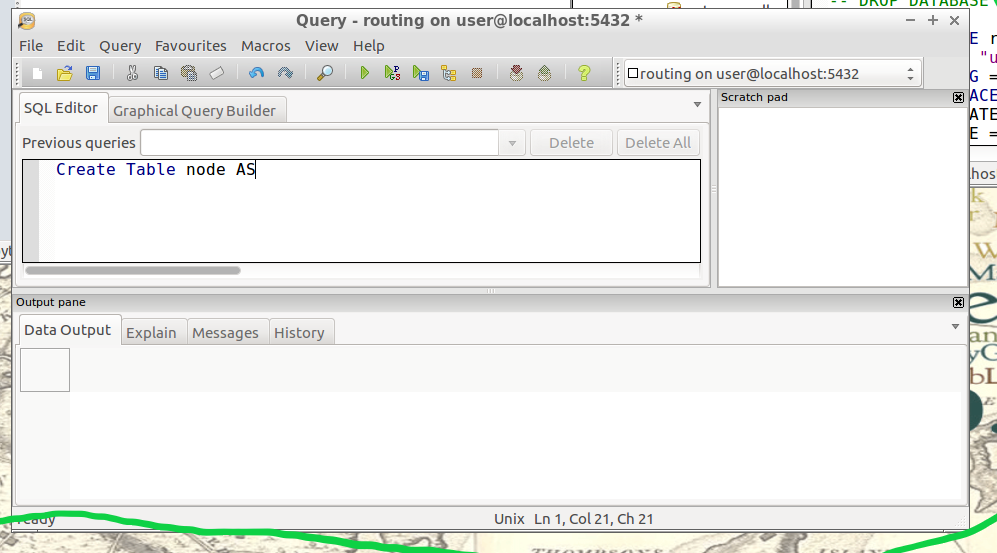
We input the below function into the SQL window of pgAdmin. Feel free to refer to this link for further information: (https://anitagraser.com/2011/02/07/a-beginners-guide-to-pgrouting/)
CREATE TABLE node AS
   SELECT row_number() OVER (ORDER BY foo.p)::integer AS id,
          foo.p AS the_geom
   FROM (
      SELECT DISTINCT roads_table.source AS p FROM roads_table
      UNION
      SELECT DISTINCT roads_table.target AS p FROM roads_table
   ) foo
   GROUP BY foo.p;
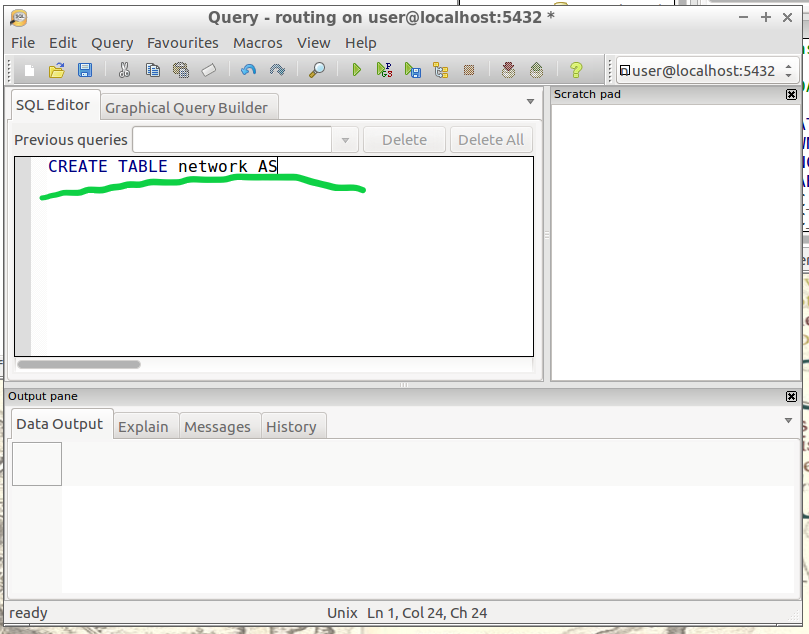
- Create a routable network: After creating the second node table from step 8, we will combine this node table(node) with our shapefile(roads_table) into one, new, table(network) that will be used as the routing network. This table will be called “network” and will be capable of processing routing queries. Please input this command and execute in SQL pgAdmin tool as we did in step 8. Here is a reference for more information:(https://anitagraser.com/2011/02/07/a-beginners-guide-to-pgrouting/)
CREATE TABLE network AS
   SELECT a.*, b.id as start_id, c.id as end_id
   FROM roads_table AS a
      JOIN node AS b ON a.source = b.the_geom
      JOIN node AS c ON a.target = c.the_geom;
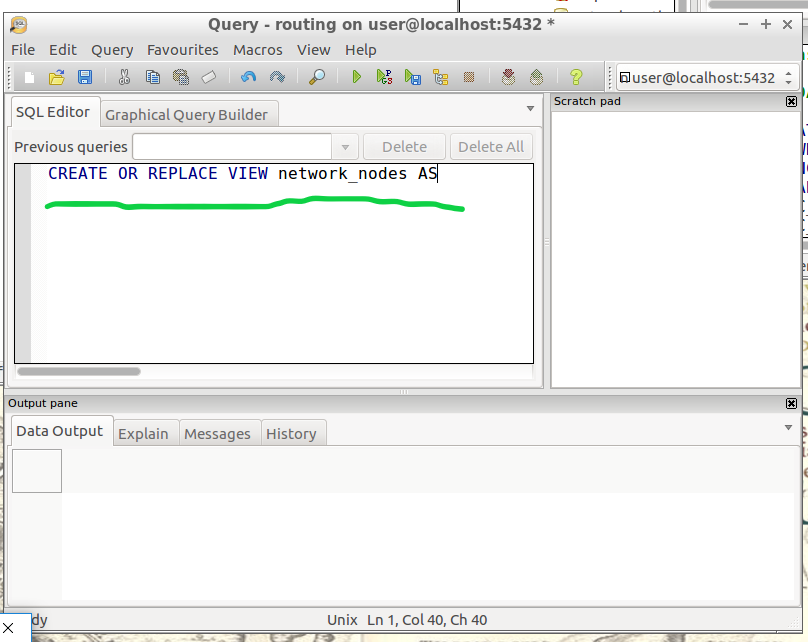
10. Create a “noded” view of the network: This new view will later be used to calculate the visual isochrones in later steps. Input this command and execute in SQL pgAdmin tool.
CREATE OR REPLACE VIEW network_nodes AS
SELECT foo.id,
 st_centroid(st_collect(foo.pt)) AS geom
FROM (
  SELECT network.source AS id,
         st_geometryn (st_multi(network.geom),1) AS pt
  FROM network
  UNION
  SELECT network.target AS id,
         st_boundary(st_multi(network.geom)) AS pt
  FROM network) foo
GROUP BY foo.id;
11. Add column for speed: This step may, or may not, apply if your original shapefile contained a field of values for road speeds.
In reality a network of roads will typically contain multiple speed limits. The shapefile you choose may have a speed field, otherwise the discrimination for the following steps will not allow varying speeds to be applied to your routing network respectfully.
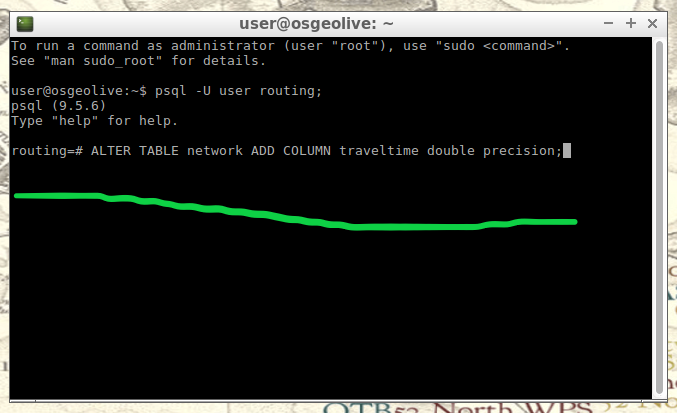
If values of speed exists in your shapefile we will implement these values into a new field, “traveltime“, that will show rate of travel for every road segment in our network based off their geometry. Firstly, we will need to create a column to store individual traveling speeds. The name of our column will be “traveltime” using the format: double precision. Input this command and execute in the command line tool as seen below.
ALTER TABLE network ADD COLUMN traveltime double precision;
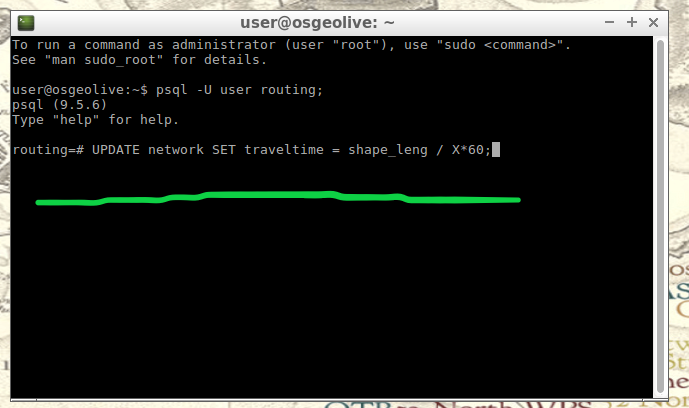
Next, we will populate the new column “traveltime” by calculating traveling speeds using an equation. This equation will take each road segments geometry(shape_leng) and divide by the rate of travel(either mph or kph). The sample command I’m using below utilizes mph as the rate while our geometry(shape_leng) units for my roads_table is in feet. If you are using either mph or kph, input this command and execute in SQL pgAdmin tool. Below further details explain the variable “X”.
UPDATE network SET traveltime = shape_leng / X*60
How to find X, here is an example: Using example 30 mph as rate. To find X, we convert 30 miles to feet, we know 5280 ft = 1 mile, so we multiply 30 by 5280 and this gives us 158400 ft. Our rate has been converted from 30 miles per hour to 158400 feet per hour. For a rate of 30 mph, our equation for the field “traveltime” equates to “shape_leng / 158400*60″. To discriminate this calculations output, we will insert additional details such as “where speed = 30;”. What this additional detail does is apply our calculated output to features with a “30” value in our “speed” field. Note: your “speed” field may be named differently.
UPDATE network SET traveltime = shape_leng / 158400*60 where speed = 30;
Repeat this step for each speed value in your shapefile examples:
UPDATE network SET traveltime = shape_leng / X*60 where speed = 45;
UPDATE network SET traveltime = shape_leng / X*60 where speed = 55;
The back end is done. Great Job!
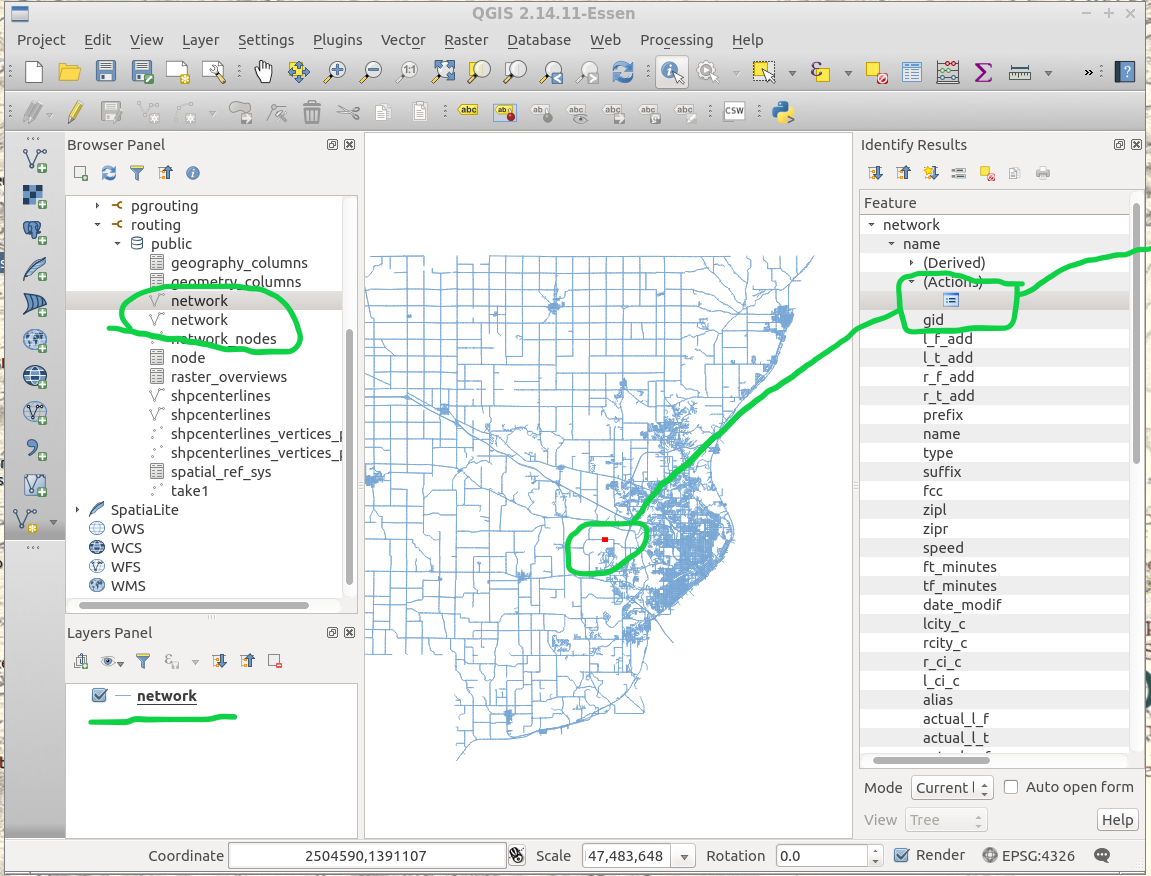
Our next step will be visualizing our data in QGIS. Open and connect QGIS to your routing database by right-clicking “PostGIS” in the Browser Panel within QGIS main window. Confirm the checkbox “Also list tables with no geometry” is checked to allow you to see the interior of your database more clearly. Fill out the name or your routing database and click “OK”.
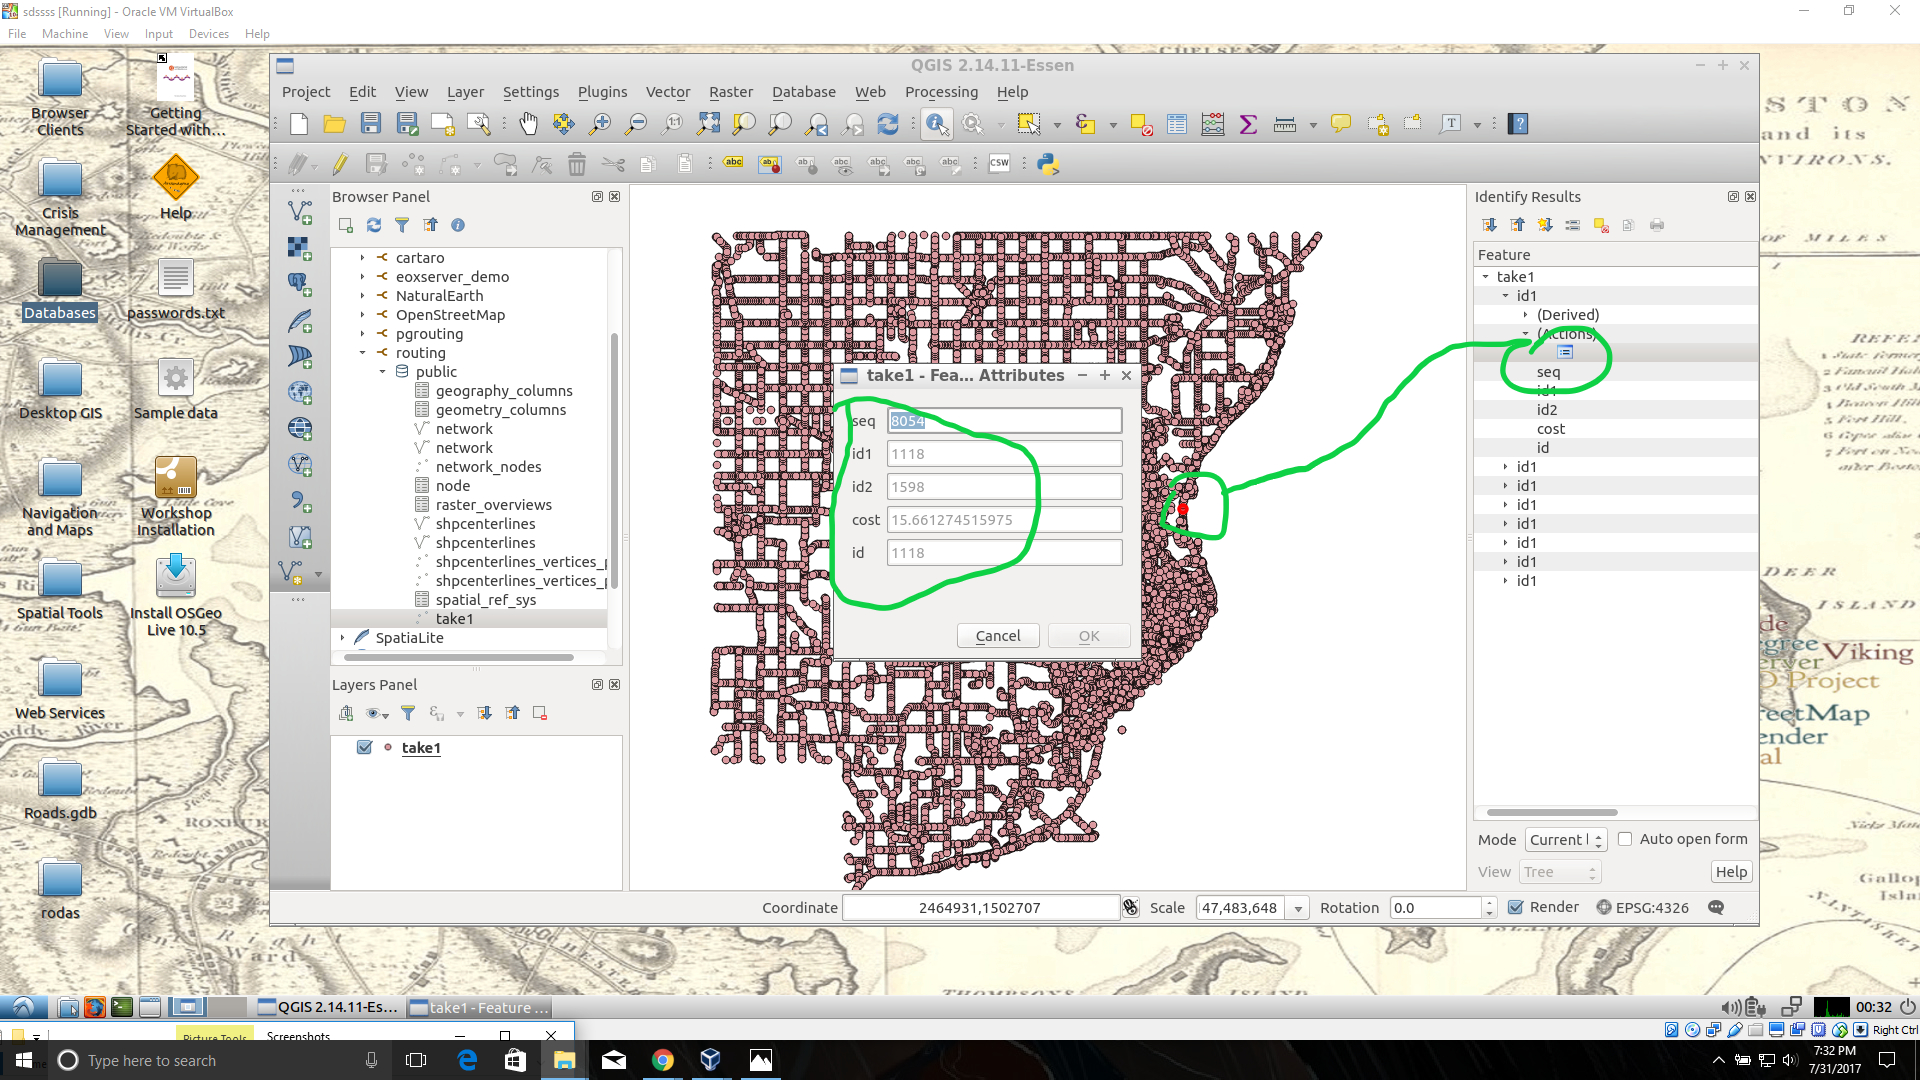
If done correctly, from QGIS you will have access to tables and views created in your routing database. Feel free to visualize your network by drag-and-drop the network table into your QGIS Layers Panel. From here you can use the identify tool to select each road segment, and see the source and target nodes contained within that road segment. The node you choose will be used in the next step to create the views of drive-time.
12. Create views: In this step, we create views from a function designed to determine the travel time cost. Transforming these views with tools will visualize the travel time costs as isochrones.
The command below will be how you start querying your database to create drive-time isochrones. Begin in QGIS by draging your network table into the contents. The visual will show your network as vector(lines). Simply select the road segment closest to your point of interest you would like to build your isochrone around. Then identify the road segment using the identify tool and locate the source and target fields.
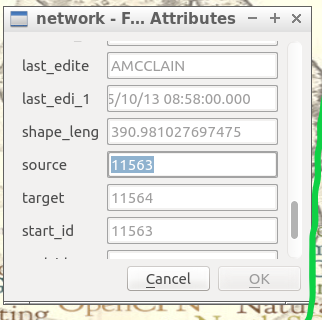
Place the source or target field value in the below command where you see VALUE, in all caps.
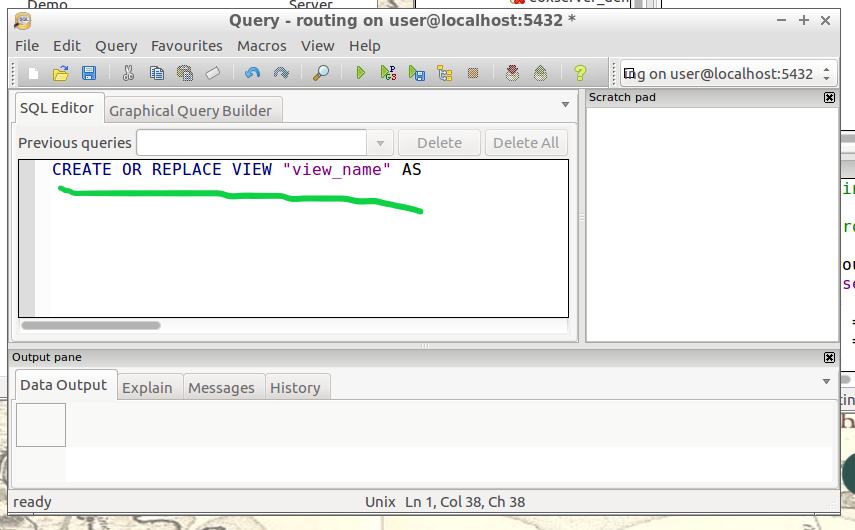
This will serve you now as an isochrone catchment function for this workflow. Please feel free to use this command repeatedly for creating new isochrones by substituting the source value. Please input this command and execute in SQL pgAdmin tool.
*AT THE BOTTOM OF THIS WORKFLOW I PROVIDED AN EXAMPLE USING SOURCE VALUE “2022”
CREATE OR REPLACE VIEW "view_name" AS
SELECT di.seq,
di.id1,
di.id2,
di.cost,
pt.id,
pt.geom
FROM pgr_drivingdistance('SELECT
gid::integer AS id,
Source::integer AS source,
Target::integer AS target,
Traveltime::double precision AS cost
FROM network'::text, VALUE::bigint,
100000::double precision, false, false)
di(seq, id1, id2, cost)
JOIN network_nodes pt ON di.id1 = pt.id;
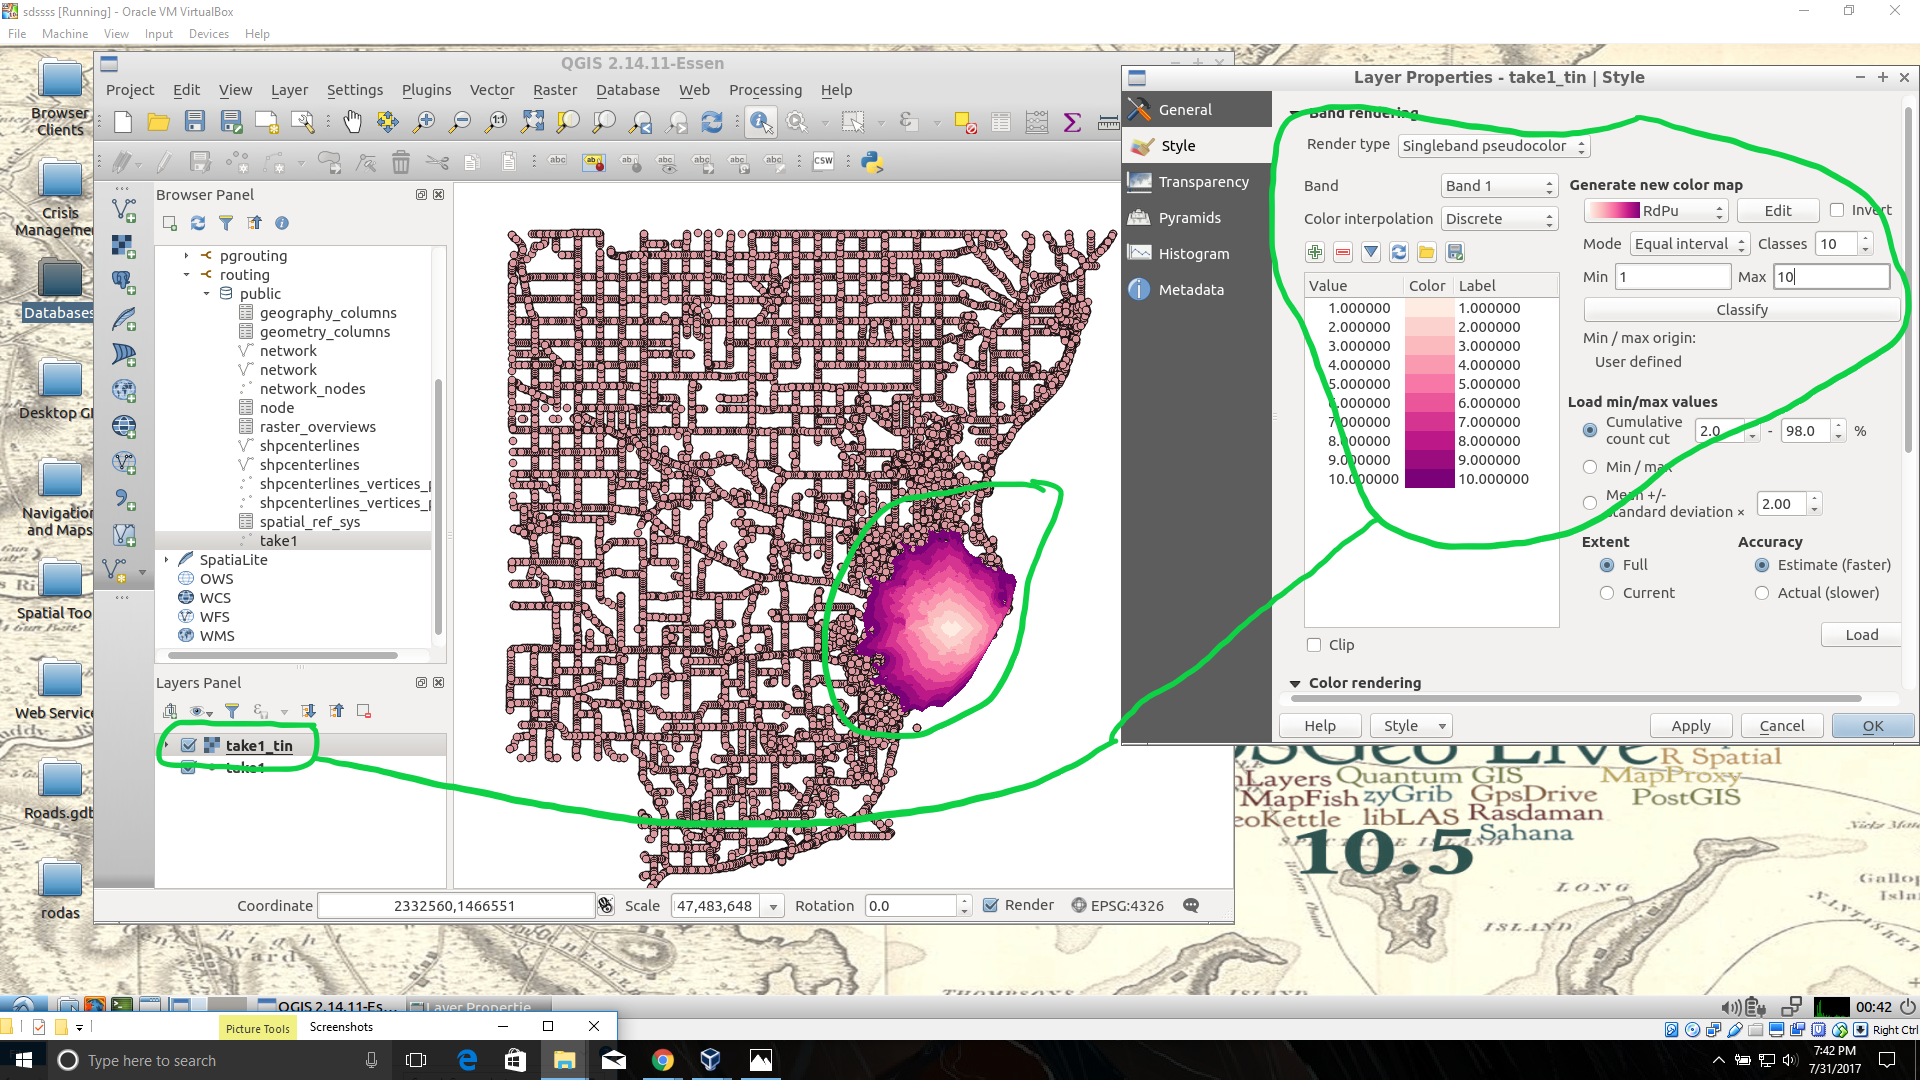
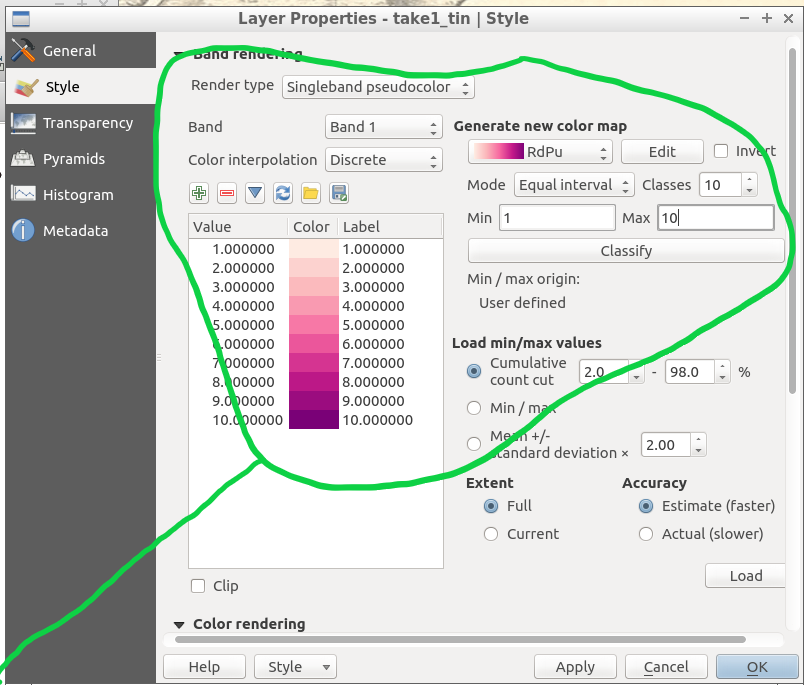
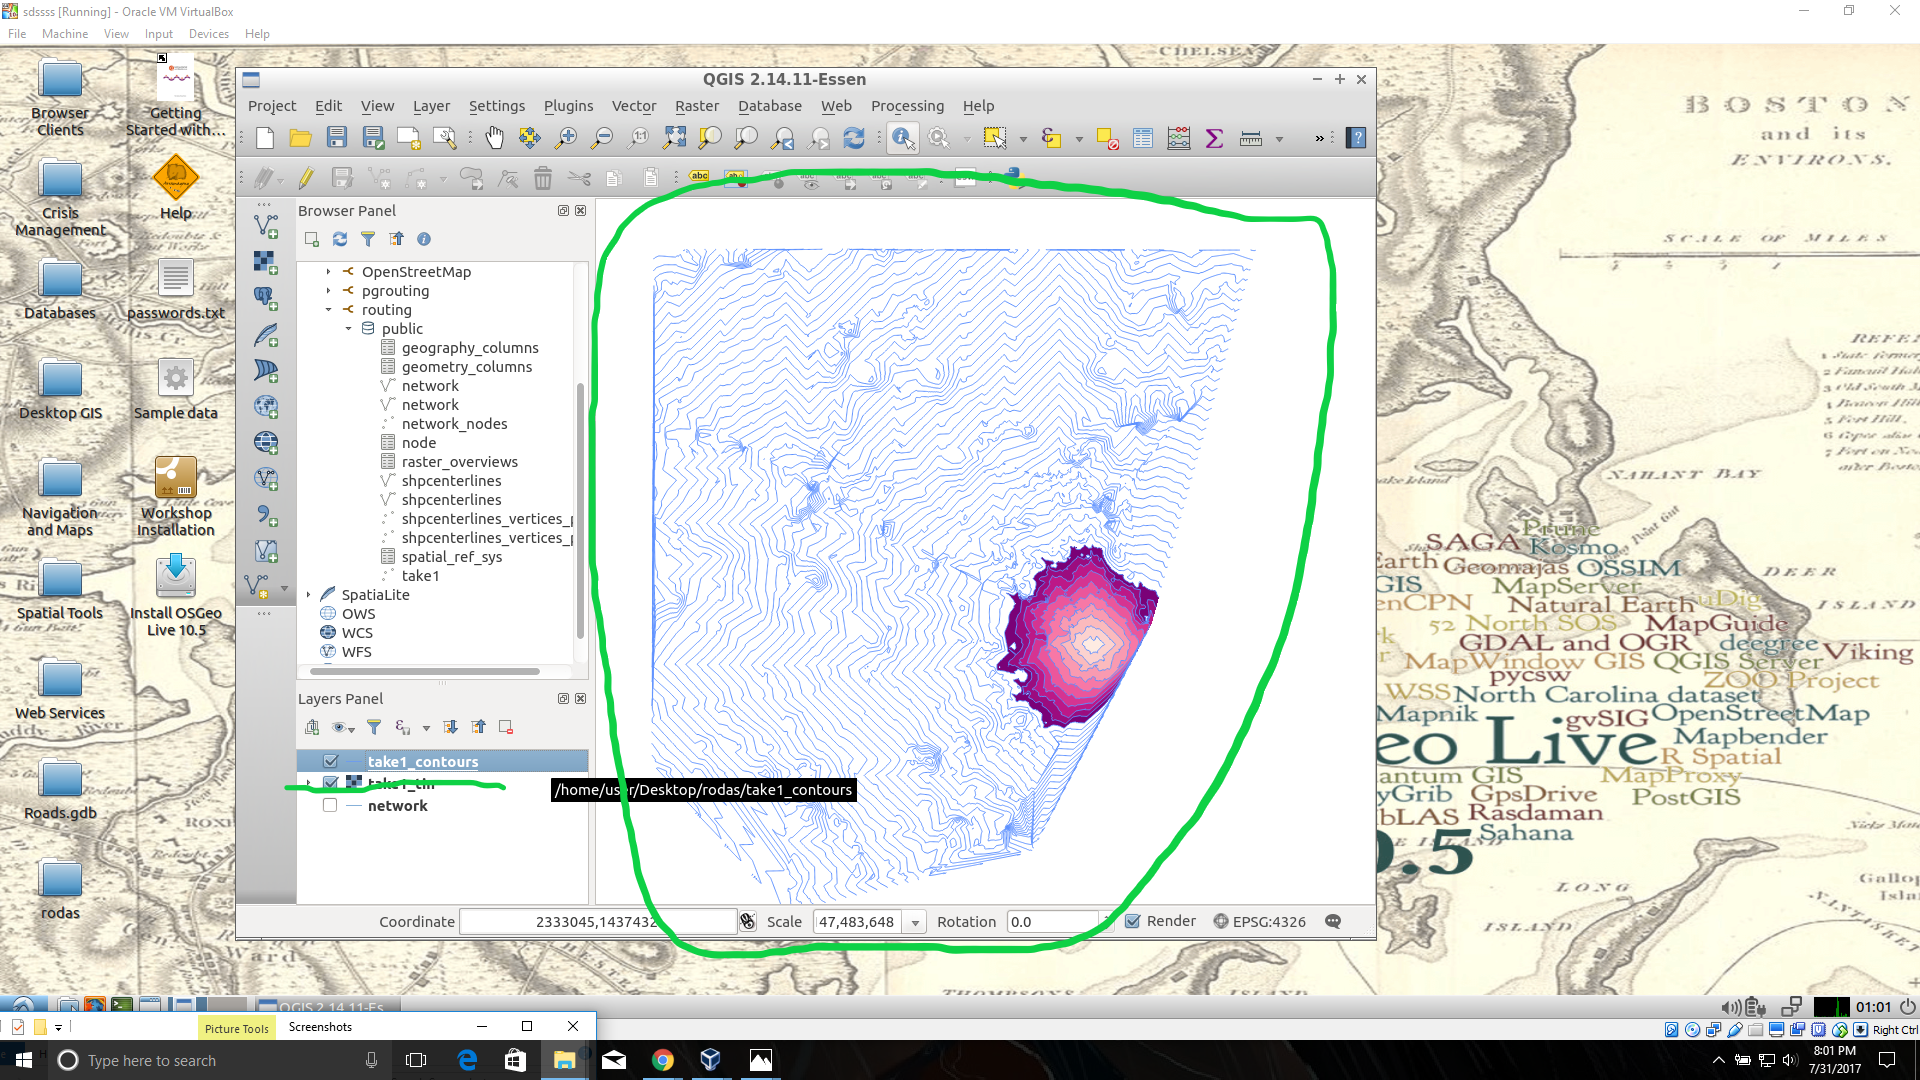
13. Visualize Isochrone: Applying tools to the view will allow us to adjust the visual aspect to a more suitable isochrone overlay.
After creating your view, a new item in your routing database is created, using the “view_name” you chose. Drag-and-drop this item into your QGIS LayersPanel. You will see lots of small dots which represent the nodes.
In the figure below, I named my view “take1“.
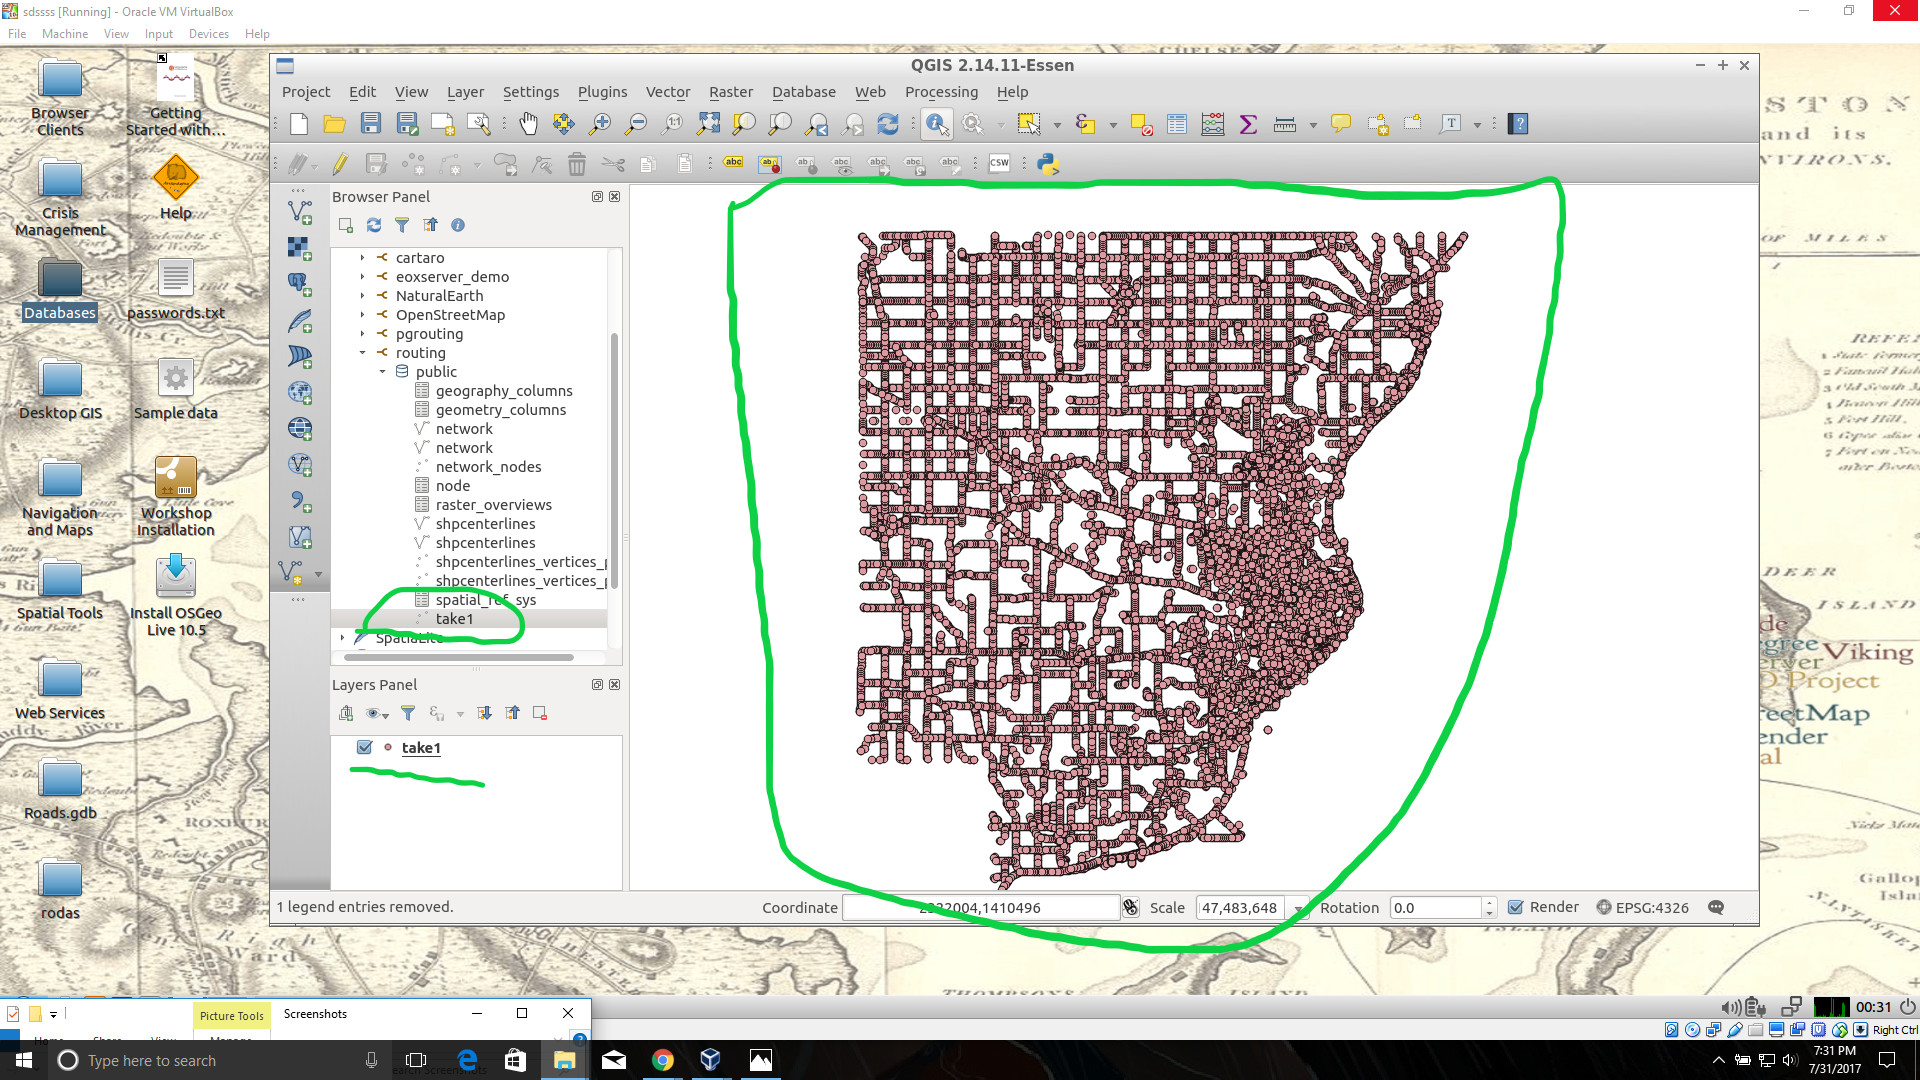
Each node you see contains a drive-time value, “cost”, which represents the time used to travel from the node you input in step 12’s function.
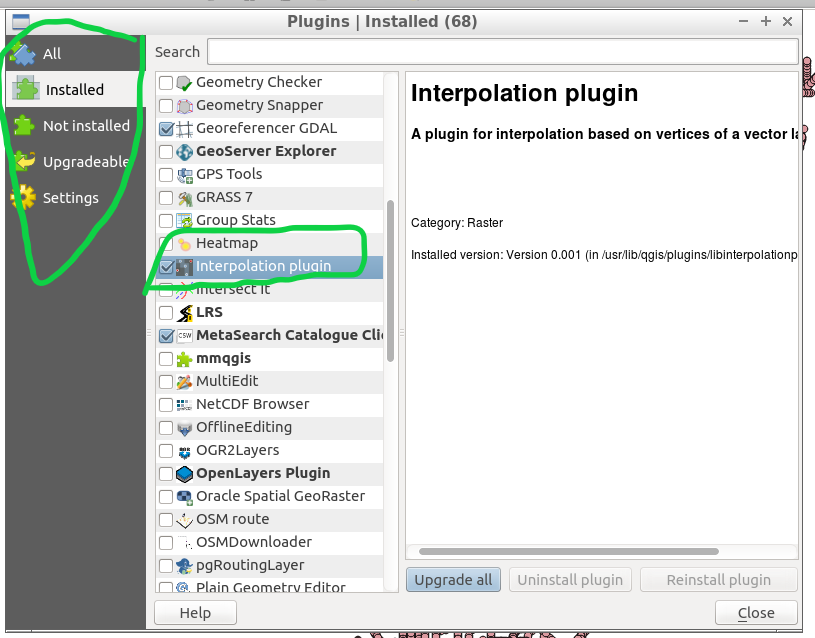
Start by installing the QGIS plug-in “Interpolation” by opening the Plugin Manager in QGIS interface.
Next, at the top of QGIS window select “Raster” and a drop-down will appear, select “Interpolation”.
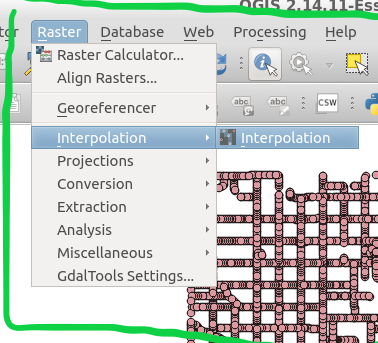
A new window pops up and asks you for input.
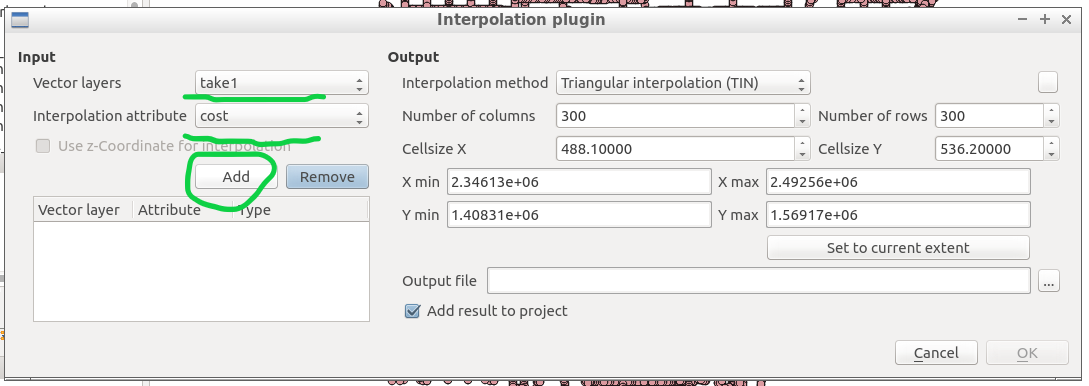
Select your “view” as the vector layer, select ”cost” as your interpolation attribute, and then click “Add”.
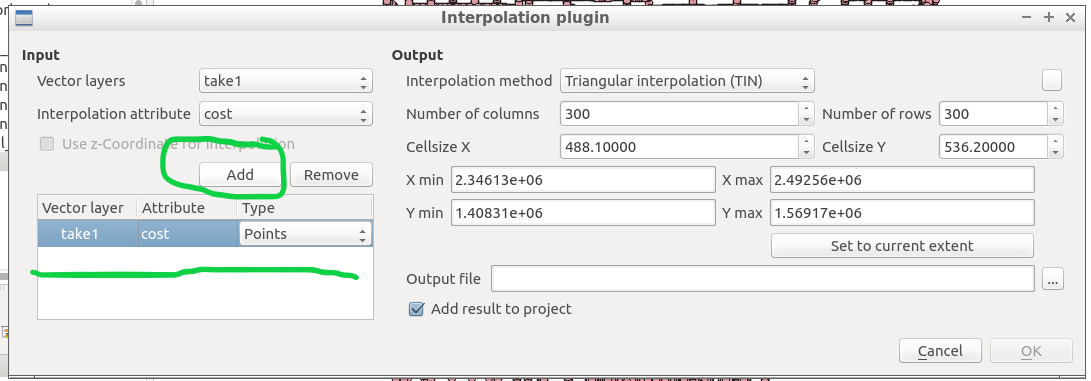
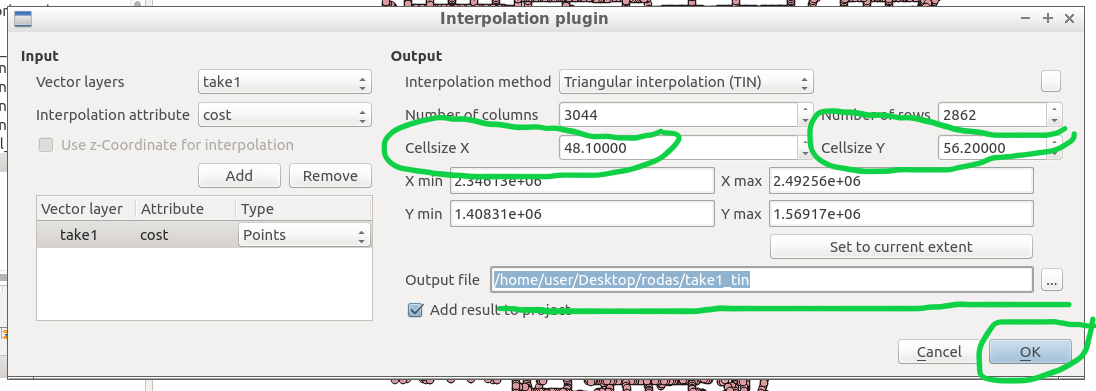
A new vector layer will show up in the bottom of the window, take care the type is “Points“. For output, on the other half of the window, keep the interpolation method as “TIN”, edit the output file location and name. Check the box “Add result to project”.
Note: decreasing the cellsize of X and Y will increase the resolution but at the cost of performance.
Click “OK” on the bottom right of the window.
A black and white raster will appear in QGIS, also in the Layers Panel a new item was created.
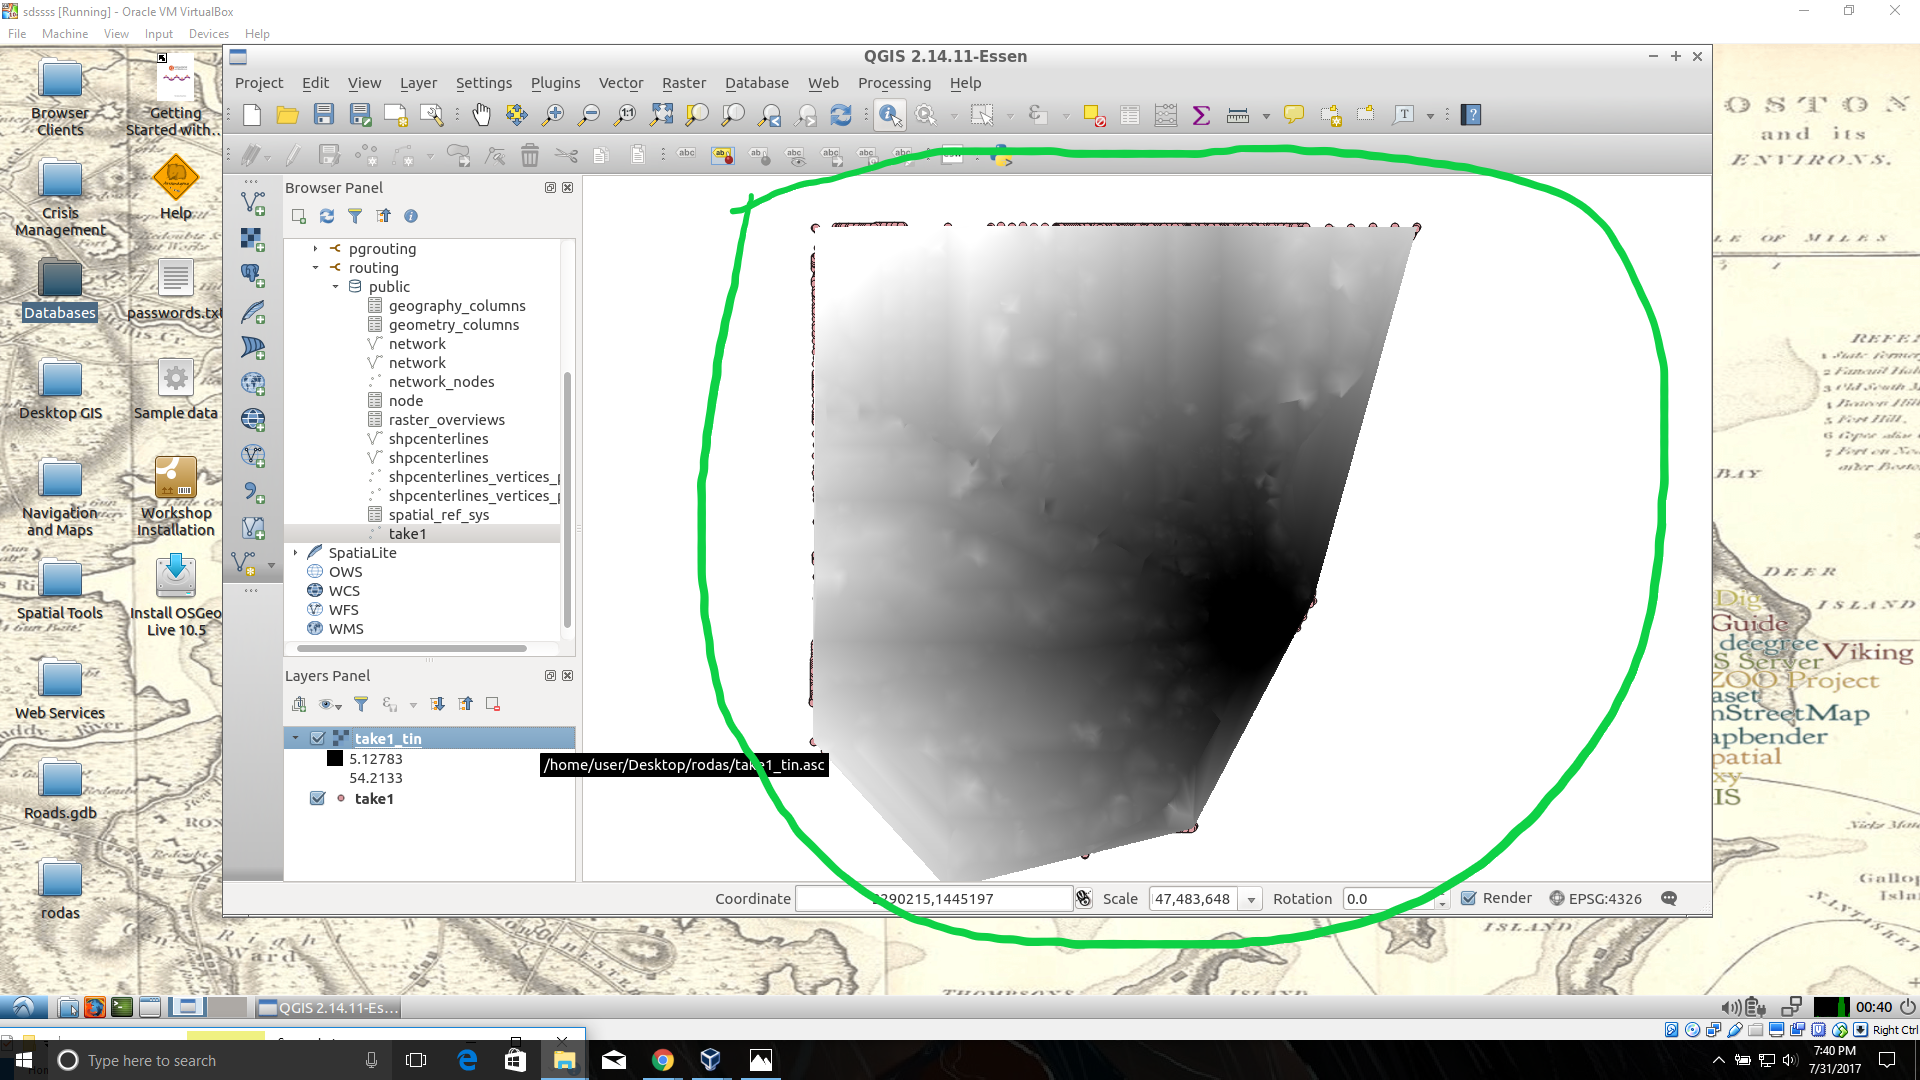
Take some time to visualize the raster by coloring and adjusting values in symbology until you are comfortable with the look.
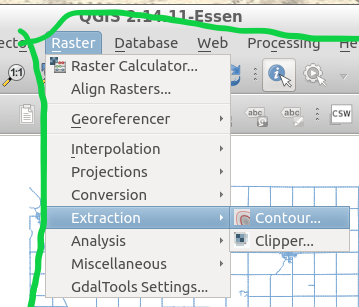
14. Create contours of our isochrone: Contours can be calculated from the isochrone as well.
Find near the top of QGIS window, open the “Raster” menu drop-down and select Extraction → Contour.
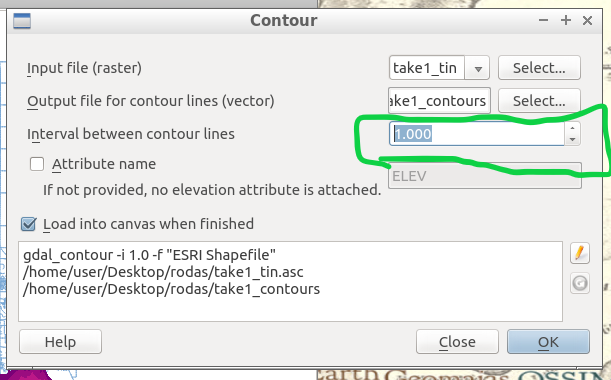
Fill out the appropriate interval between contour lines but leave the check box “Attribute name” unchecked. Click “OK”.
15. Zip and Share: Find where you saved your TIN and contours, compress them in a zip folder by highlighting them both and right-click to select “compress”. Email the compressed folder to yourself to export out of your virtual machine.
Example Isochrone catchment for this workflow:
CREATE OR REPLACE VIEW "2022" AS
SELECT di.seq, Di.id1, Di.id2, Di.cost,
       Pt.id, Pt.geom
FROM pgr_drivingdistance('SELECT gid::integer AS id,
     Source::integer AS source, Target::integer AS target,
     Traveltime::double precision AS cost FROM network'::text,
     2022::bigint, 100000::double precision, false, false)
   di(seq, id1, id2, cost)
JOIN netowrk_nodes pt
ON di.id1 = pt.id;
References: Virtual Box ORACLE VM, OSGeo-Live 11 amd64 iso, Workshop FOSS4G Bonn(http://workshop.pgrouting.org/2.2.10/en/index.html),