Heat up your maps!
The project is called “OLHeatmap” and the results look promising:
Try it out yourself using the Live Demo.
You find the project’s homepage at Sourceforge.
Heat up your maps!
The project is called “OLHeatmap” and the results look promising:
Try it out yourself using the Live Demo.
You find the project’s homepage at Sourceforge.
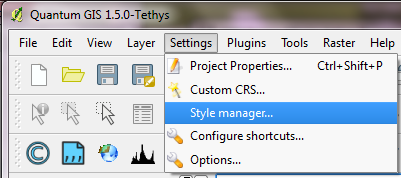
While this is not a new addition to QGIS anymore – in fact it has been around since 1.4 – I feel it’s not as widely know as it should be: QGIS offers the power of ColorBrewer to create color ramps! And this is how you get to use this power:
All styles: marker, line, fill and color ramps can be accessed via “Style manager”:
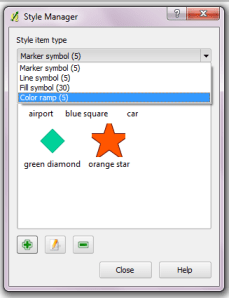
In Style Manager you can add, edit and delete styles:

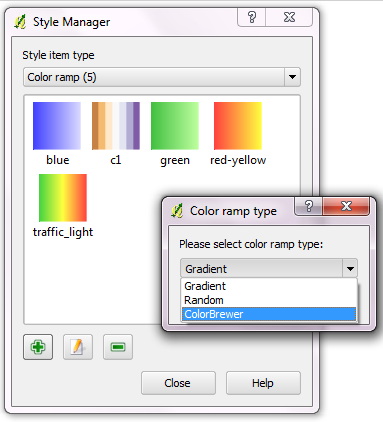
When creating a new color ramp, you get to choose between “Gradient”, “Random” and finally “ColorBrewer” ramp type. (By the way: You can create multi-color color ramps if you choose “Gradient”.)
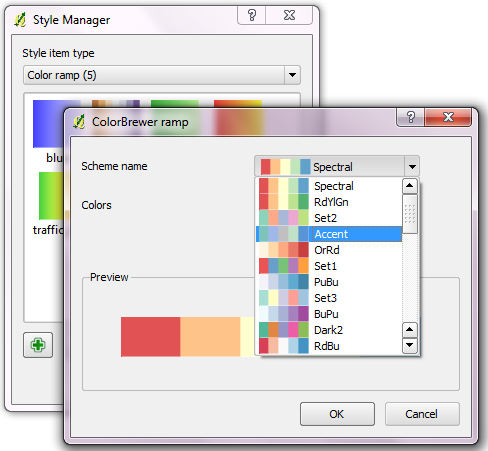
When creating a ColorBrewer ramp, you can choose from various schemes and define how many colors your ramp should contain:
I love these new ramps and I wish I’d have discovered them sooner :)
Enjoy the power of ColorBrewer and QGIS!
QGIS Mapserver is now in QGIS trunk. Check Linfiniti Geo Blog to learn how to set it up and just how powerful this new server is. We’re all looking forward to see how QGIS Mapserver performs compared to older projects like UMN Mapserver and Geoserver at the WMS Benchmarking in Barcelona.
FOSS4G 2010 conference in Barcelona is coming closer and closer. Have a look at this year’s presentations. Presentations are held on a variety of topics including:
This year’s Google Summer of Code project for QGIS “QGIS on Steroids” has come to an successful end. The resulting improvements are currently available through http://svn.osgeo.org/qgis/branches/threading-branch/ and will be available in trunk after more testing.
Read Martin’s full report on QGIS wiki.
The QGIS Community Team proudly presents three new QGIS user reports aka Case Studies:
“… I realized that QGIS was the only one which can connect to WMS, WCS and WFS successfully.”
“I found that QGIS provided a very intuitive interface for GRASS, hat they complemented each other perfectly, and they provided all the analytical capabilities I needed.”
“The most important qualities of QGIS are the intuitive user interface and the compatibility with different file formats. It is an ideal tool for projects that are on one hand based on existing geographic data and on the other hand require the acquisition of new data.”
If you would like to share your own story, just contact the QGIS community team. All contributions welcome!
The QGIS developer team has just announced the release of QGIS 1.5. Check the official visual change log featuring a list of the most prominent changes and many screen shots.
gis.stackexchange.com is now in public beta. Join the community to learn and/or share GIS knowledge.
Right now, gis.stackexchange.com has 329 users and 395 questions have been asked (92 % answered). The page has only been online for a week now, but the community is growing fast.
Join now and help us advertise this new community page!
Creating new datasets can be a tedious task. To make things easier, QGIS enables users to customize the editing dialogue.
Users can choose from one of the following editing widgets:
A useful and powerful way to define layer symbology and labels is using data-defined properties. While many of the options are self-explanatory, others require knowledge about the valid options.
Note: These options are currently only available for the “old” labeling under “Advanced” tab.
Valid options are: left, right, bottom, top, bottom_left, bottom_right, top_left, top_right
I successfully used the color names red, blue, green, black, yellow, and orange. Alternatively, you can enter color hex-codes: red = #ff0000