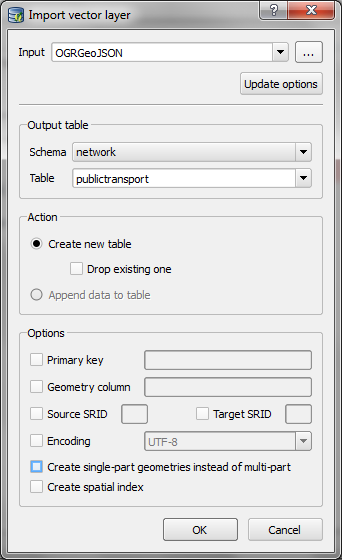
This post covers a simple approach to calculating isochrones in a public transport network using pgRouting and QGIS.
For this example, I’m using the public transport network of Vienna which is loaded into a pgRouting-enable database as network.publictransport. To create the routable network run:
select pgr_createTopology('network.publictransport', 0.0005, 'geom', 'id');
Note that the tolerance parameter 0.0005 (units are degrees) controls how far link start and end points can be apart and still be considered as the same topological network node.
To create a view with the network nodes run:
create or replace view network.publictransport_nodes as
select id, st_centroid(st_collect(pt)) as geom
from (
	(select source as id, st_startpoint(geom) as pt
	from network.publictransport
	)
union
	(select target as id, st_endpoint(geom) as pt
	from network.publictransport
	)
) as foo
group by id;
To calculate isochrones, we need a cost attribute for our network links. To calculate travel times for each link, I used speed averages: 15 km/h for buses and trams and 32km/h for metro lines (similar to data published by the city of Vienna).
alter table network.publictransport add column length_m integer;
update network.publictransport set length_m = st_length(st_transform(geom,31287));

alter table network.publictransport add column traveltime_min double precision;
update network.publictransport set traveltime_min = length_m  / 15000.0 * 60; -- average is 15 km/h
update network.publictransport set traveltime_min = length_m  / 32000.0 * 60 where "LTYP" = '4'; -- average metro is 32 km/h
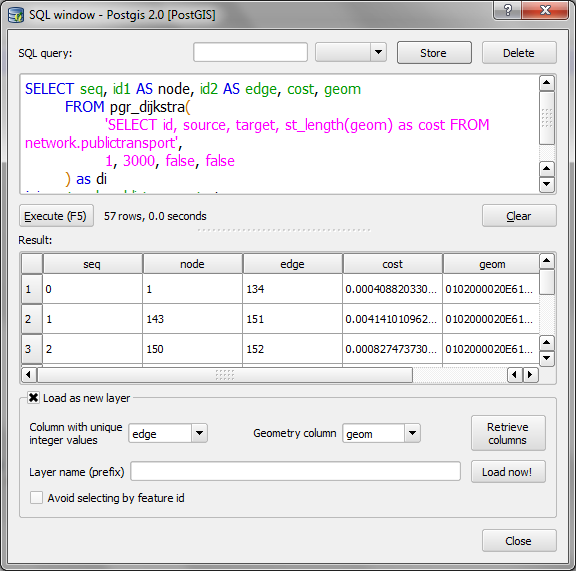
That’s all the preparations we need. Next, we can already calculate our isochrone data using pgr_drivingdistance, e.g. for network node #1:
create or replace view network.temp as
 SELECT seq, id1 AS node, id2 AS edge, cost, geom
  FROM pgr_drivingdistance(
    'SELECT id, source, target, traveltime_min as cost FROM network.publictransport',
    1, 100000, false, false
  ) as di
  JOIN network.publictransport_nodes pt
  ON di.id1 = pt.id;
The resulting view contains all network nodes which are reachable within 100,000 cost units (which are minutes in our case).
Let’s load the view into QGIS to visualize the isochrones:

The trick is to use data-defined size to calculate the different walking circles around the public transport stops. For example, we can set up 10 minute isochrones which take into account how much time was used to travel by pubic transport and show how far we can get by walking in the time that is left:
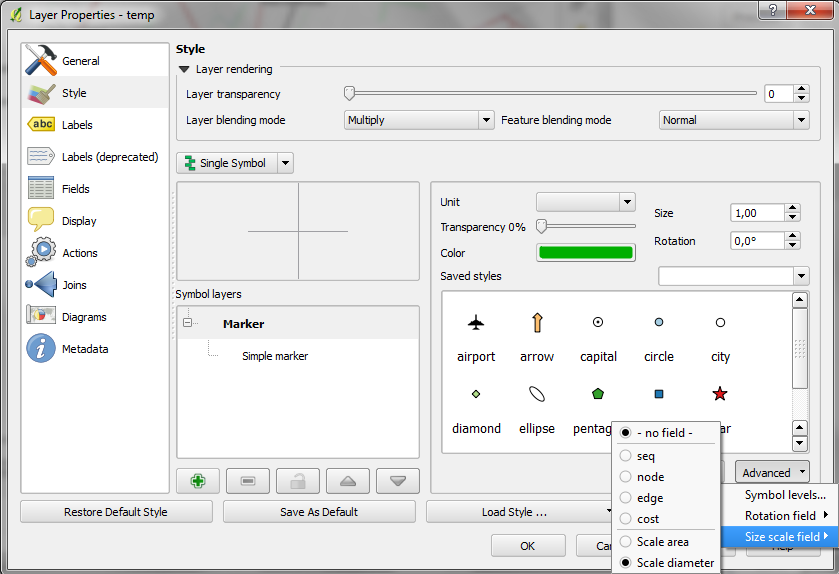
1. We want to scale the circle radius to reflect the remaining time left to walk. Therefore, enable Scale diameter in Advanced | Size scale field:

2. In the Simple marker properties change size units to Map units.
3. Go to data defined properties to set up the dynamic circle size.

The expression makes sure that only nodes reachable within 10 minutes are displayed. Then it calculates the remaining time (10-"cost") and assumes that we can walk 100 meters per minute which is left. It additionally multiplies by 2 since we are scaling the diameter instead of the radius.
To calculate isochrones for different start nodes, we simply update the definition of the view network.temp.
While this approach certainly has it’s limitations, it’s a good place to start learning how to create isochrones. A better solution should take into account that it takes time to change between different lines. While preparing the network, more care should to be taken to ensure that possible exchange nodes are modeled correctly. Some network links might only be usable in one direction. Not to mention that there are time tables which could be accounted for ;)