Archive

Tag Archives: QGIS

A great enhancement has been added to “Delimited Text” plugin today. It allows the use of a geometry column formatted as well known text (WKT), as an alternative to using x and y columns to define point features.

Requirements

To view a delimited text file as layer, the text file must contain:

  1. A delimited header row of field names. This must be the first line in the text file.
  2. The header row must contain an X and Y field or a Well Known Text (WKT) field. These fields can have any name.
  3. The WKT field must be in standard format.

Example of a valid text file with a WKT field

id|wkt
1|POINT(172.0702250 -43.6031036)
2|POINT(172.0702250 -43.6031036)
3|POINT(172.1543206 -43.5731302)
4|POINT(171.9282585 -43.5493308)
5|POINT(171.8827359 -43.5875983)

Update: Tim has posted a video tutorial: Video tutorial #2: Delimited Text Plugin

QGIS 1.6 is now officially released. Read the announcement on QGIS blog for information on new features or go directly to the download page.

Update: The QGIS manual has also been brought up-to-date.

ERDAS’ ECW licensing does not allow free redistribution. Therefore, QGIS can’t support .ecw out of the box. However, you can download ERDAS’ SDK – which gives access to .ecw rasters – from their website for free.

If you need ECW support in QGIS and are struggling, you might find Micha Silver’s post “QGIS on Windows with ECW” very helpful.

Starting from scratch can be painful. Luckily there’s a tool out there that can help: PyQGIS Plugin Builder. The form will build a minimal plugin for you. You’ll get a ready QGIS 1.0 plugin that implements an empty dialog with Ok and Close buttons. You can find a step-by-step description on how to create and modify this dummy plugin at linfiniti.com – “A simple QGIS python tutorial”.

From there, I suggest moving to the PyQGIS Cookbook – a great resource for everything related to QGIS with Python – especially the part about “Developing Python Plugins”. Tim also created a PDF version of the Cookbook (original post) if you prefer it in hard copy.

The enhancement request Support for “selected features only” in “Select by location” is now implemented.

Thanks Carson!

Three new label editing tools found their way into the QGIS developer version:

  1. move label tool … move text labels to a new position
  2. rotate label tool … allows for interactive rotation of labels
  3. label property tool … opens a dialog where users can manipulate the properties and text of a label

These tools allow you to mix fixed label positions and automatic label positioning inside a project. If the x or y attribute value is NULL, the position will be set automatically. When a label position is changed using “move label tool”, the position is written into the attribute fields and the label position for this feature is fixed.

To use these tools on existing layers, add x, y and rotation attribute fields (type double). By default, all values will be NULL and thus the layer will be labeled automatically. Now you’re ready to move and rotate the labels as you like.

For more information check: www.sourcepole.com

A cartogram is a map where some variable (e.g. population) is substituted for land area or distance. The geometry of the map is distorted to convey the information of this variable.

“Cartogram Creator” is a Python plugin for QGIS available through Carson Farmer’s repository.

Cartogram Creator icon

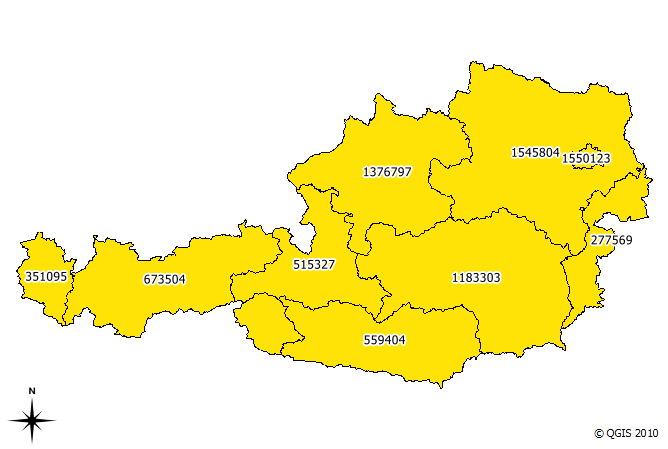
To use this plugin, you need a polygon layer with the attribute you want to be represented in the cartogram. I’m using a small file of Austrian regions with population data:

base data (Austrian regions and number of inhabitants)

The small island in the north-east is Vienna, the Austrian capital. With more than 1.5 million inhabitants, it is the region with highest population. This fact should be visible in the resulting cartogram.

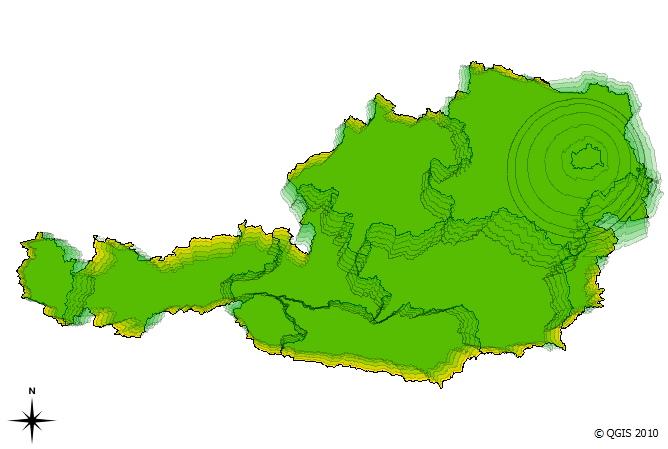
I chose to run five iterations of the plugin algorithm. The plugin allows saving of each iteration’s result. This is how the shape of the region changes through the iterations:

cartogram iterations (n=5)

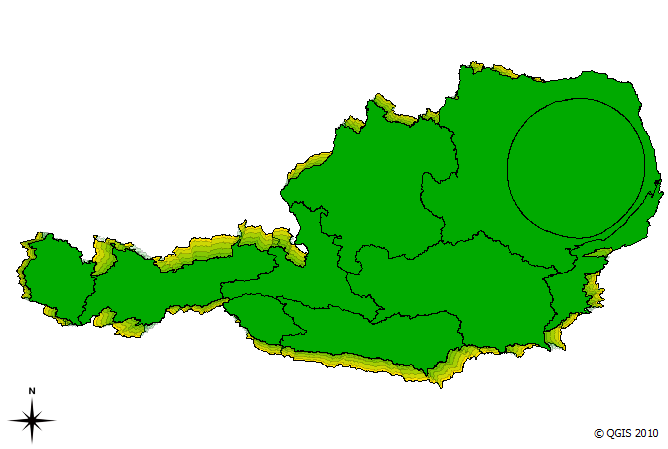
We can see Vienna “growing”. The final result looks like this:

cartogram result after five interations

The cartogram shows pretty clearly that the Vienna region is home to a considerable population.

MMQGIS is a set of Python plugins for manipulating vector map layers in Quantum GIS. […] MMQGIS does offer some useful tools missing from native QGIS or common plugin sets …

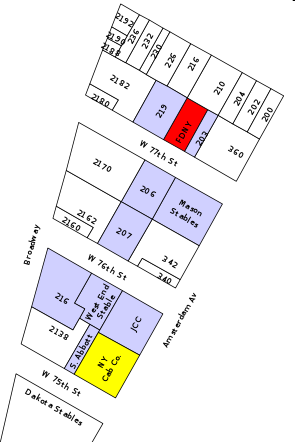
Labels Layer example

Labels Layer example

MMQGIS currently contains the following tools:

  • Attributes Export to CSV File
  • Attribute Join from CSV File
  • Color Map (Well, that’s redundant now and probably better implemented in core QGIS.)
  • Create Grid Layer
  • Create Label Layer
  • Geocode from Google
  • Geocode from Street Layer
  • Gridify
  • Hub Distance
  • Merge Layers
  • Select
  • Sort
  • Text to Float
  • Voronoi Diagram

The project homepage is located at michaelminn.com.

The following code snippet contains the constructor of a GUI control class for QGIS plugins. It’s job is to initialize the plugin GUI (a dock widget in this case) and create signal connections:

import os
from PyQt4.QtCore import *
from PyQt4.QtGui import *
from PyQt4 import uic
from qgis.core import *

class MyGuiControl(QObject):
    """This class controls all plugin-related GUI elements."""

    def __init__ (self,iface):
        """initialize the GUI control"""
        QObject.__init__(self)
        self.iface = iface

        # load the form
        path = os.path.dirname( os.path.abspath( __file__ ) )
        self.dock = uic.loadUi( os.path.join( path, "mywidget.ui" ) )
        self.iface.addDockWidget( Qt.RightDockWidgetArea, self.dock )

        # connect to gui signals
        QObject.connect(self.dock...
        ...

Using uic.loadUi is a convenient way to create a user interface with minimum effort. Of course the performance might be better if we compile the .ui code to python first, but during development phase this saves us an extra step.