Computing network centers
How do you objectively define and compute which parts of a network are in the center? One approach is to use the concept of centrality.
Centrality refers to indicators which identify the most important vertices within a graph. Applications include identifying the most influential person(s) in a social network, key infrastructure nodes in the Internet or urban networks, and super spreaders of disease. (Source: http://en.wikipedia.org/wiki/Centrality)
Researching this topic, it turns out that some centrality measures have already been implemented in GRASS GIS. thumbs up!
v.net.centrality computes degree, betweeness, closeness and eigenvector centrality.
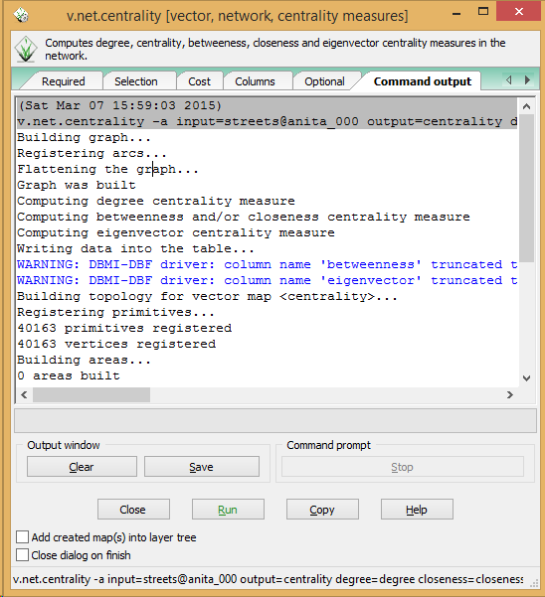
As a test, I’ve loaded the OSM street network of Vienna and run
v.net.centrality -a input=streets@anita_000 output=centrality degree=degree closeness=closeness betweenness=betweenness eigenvector=eigenvector
The computations take a while.
In my opinion, the most interesting centrality measures for this street network are closeness and betweenness:
Closeness “measures to which extent a node i is near to all the other nodes along the shortest paths”. Closeness values are lowest in the center of the network and higher in the outskirts.
Betweenness “is based on the idea that a node is central if it lies between many other nodes, in the sense that it is traversed by many of the shortest paths connecting couples of nodes.” Betweenness values are highest on bridges and other important arterials while they are lowest for dead-end streets.
(Definitions as described in more detail in Crucitti, Paolo, Vito Latora, and Sergio Porta. “Centrality measures in spatial networks of urban streets.” Physical Review E 73.3 (2006): 036125.)
Works great! Unfortunately, v.net.centrality is not yet part of the QGIS Processing GRASS toolbox. It would certainly be a great addition.

