Trajectory animations with fadeout effect
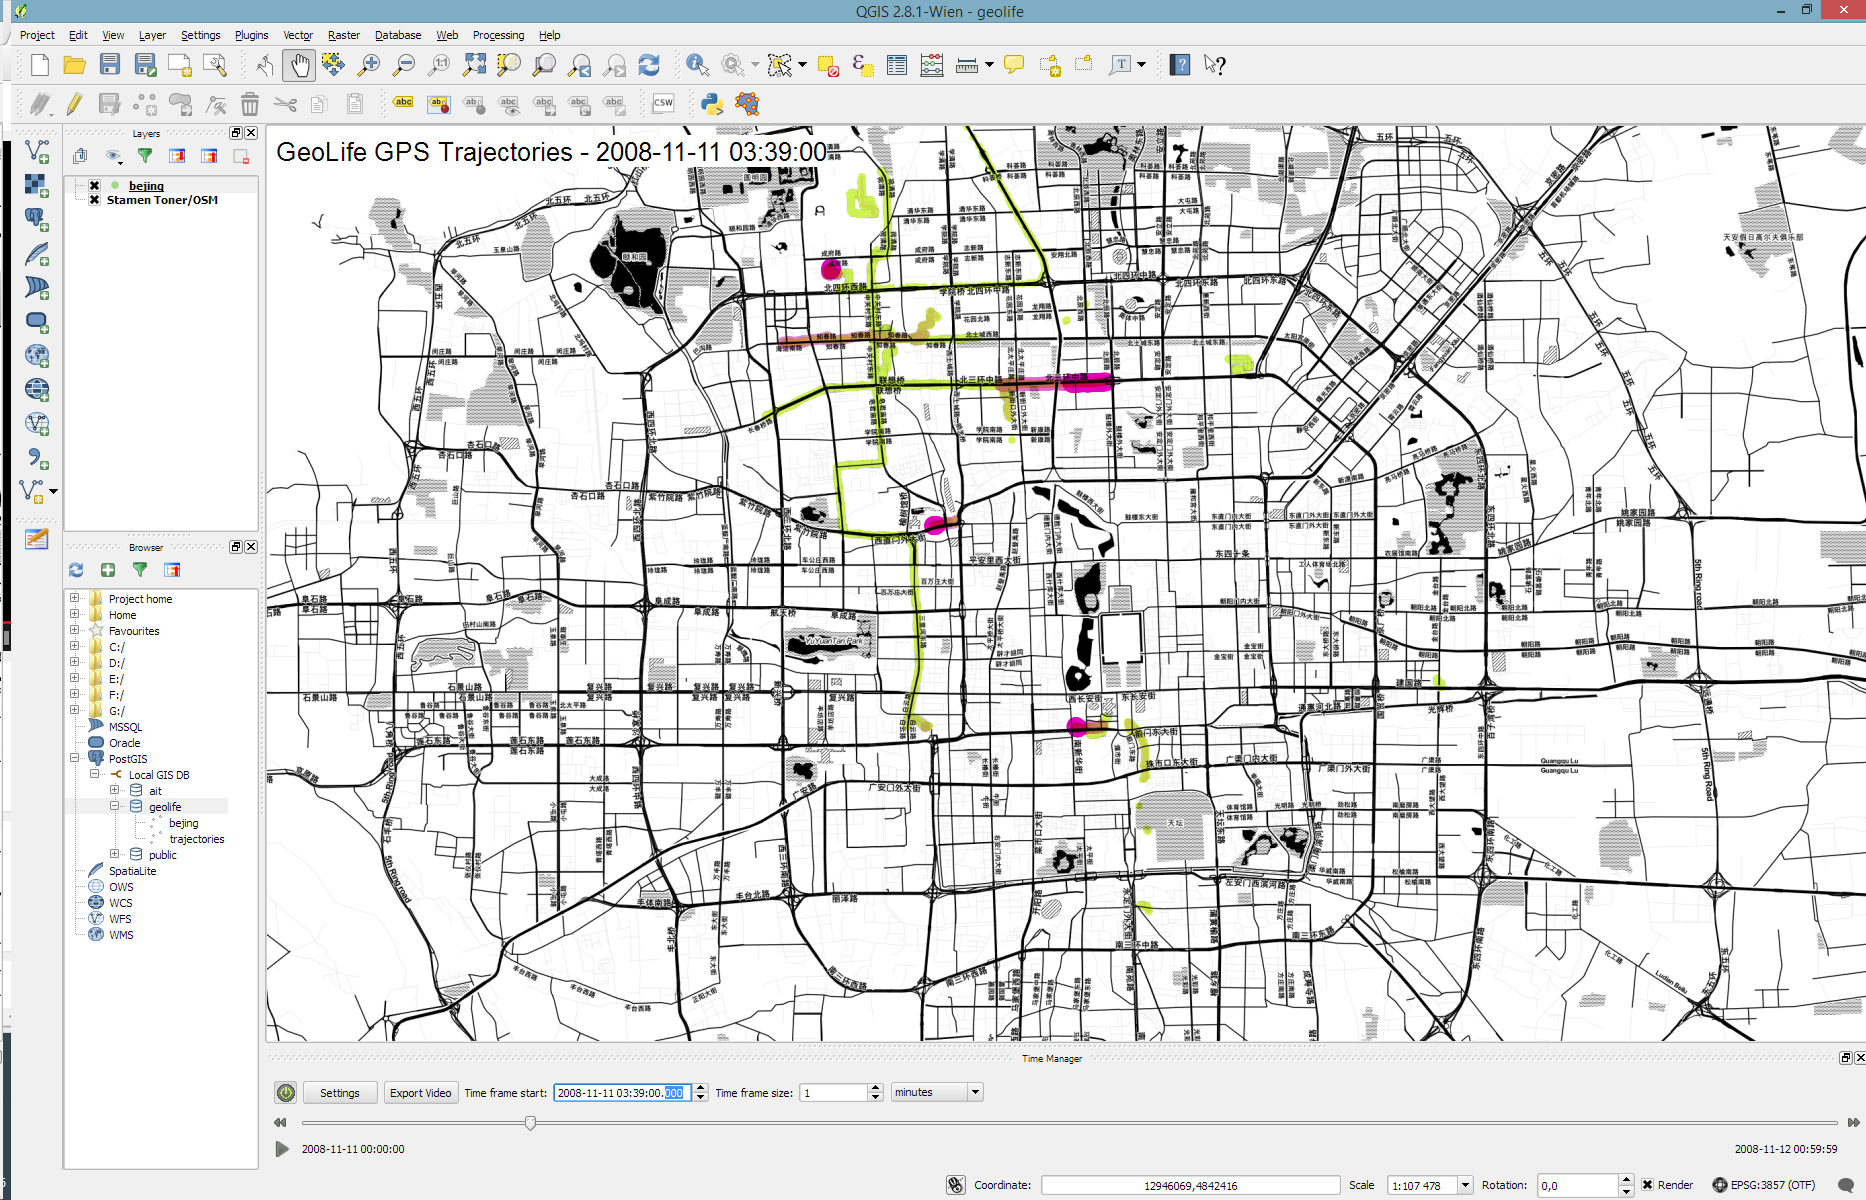
Today’s post is a short tutorial for creating trajectory animations with a fadeout effect using QGIS Time Manager. This is the result we are aiming for:
The animation shows the current movement in pink which fades out and leaves behind green traces of the trajectories.
About the data
GeoLife GPS Trajectories were collected within the (Microsoft Research Asia) Geolife project by 182 users in a period of over three years (from April 2007 to August 2012). [1,2,3] The GeoLife GPS Trajectories download contains many text files organized in multiple directories. The data files are basically CSVs with 6 lines of header information. They contain the following fields:
Field 1: Latitude in decimal degrees.
Field 2: Longitude in decimal degrees.
Field 3: All set to 0 for this dataset.
Field 4: Altitude in feet (-777 if not valid).
Field 5: Date – number of days (with fractional part) that have passed since 12/30/1899.
Field 6: Date as a string.
Field 7: Time as a string.
Data prep: PostGIS
Since any kind of GIS operation on text files will be quite inefficient, I decided to load the data into a PostGIS database. This table of millions of GPS points can then be sliced into appropriate chunks for exploration, for example, a day in Beijing:
CREATE MATERIALIZED VIEW geolife.beijing
AS SELECT trajectories.id,
    trajectories.t_datetime,
    trajectories.t_datetime + interval '1 day' as t_to_datetime,
    trajectories.geom,
    trajectories.oid
   FROM geolife.trajectories
   WHERE st_dwithin(trajectories.geom,
           st_setsrid(
             st_makepoint(116.3974589,
                           39.9388838),
             4326),
           0.1)
   AND trajectories.t_datetime >= '2008-11-11 00:00:00'
   AND trajectories.t_datetime < '2008-11-12 00:00:00'
WITH DATA
Trajectory viz: a fadeout effect for point markers
The idea behind this visualization is to show both the current movement as well as the history of the trajectories. This can be achieved with a fadeout effect which leaves behind traces of past movement while the most recent positions are highlighted to stand out.
Map tiles by Stamen Design, under CC BY 3.0. Data by OpenStreetMap, under ODbL.
This effect can be created using a Single Symbol renderer with a marker symbol with two symbol layers: one layer serves as the highlights layer (pink) while the second layer represents the traces (green) which linger after the highlights disappear. Feature blending is used to achieve the desired effect for overlapping markers.

The highlights layer has two expression-based properties: color and size. The color fades to white and the point size shrinks as the point ages. The age can be computed by comparing the point’s t_datetime timestamp to the Time Manager animation time $animation_datetime.
This expression creates the color fading effect:
color_hsv(
  311,
  scale_exp(
    minute(age(animation_datetime(),"t_datetime")),
    0,60,
    100,0,
    0.2
  ),
  90
)
(Note that before QGIS 2.10, we had to use $animation_datetime instead of animation_datetime().)
and this expression makes the point size shrink:
scale_exp(
  minute(age(animation_datetime(),"t_datetime")), 0,60, 24,0, 0.2 )
Outlook
I’m currently preparing this and a couple of other examples for my Time Manager workshop at the upcoming 1st QGIS conference in Nødebo. The workshop materials will be made available online afterwards.
Literature
[1] Yu Zheng, Lizhu Zhang, Xing Xie, Wei-Ying Ma. Mining interesting locations and travel sequences from GPS trajectories. In Proceedings of International conference on World Wild Web (WWW 2009), Madrid Spain. ACM Press: 791-800.
[2] Yu Zheng, Quannan Li, Yukun Chen, Xing Xie, Wei-Ying Ma. Understanding Mobility Based on GPS Data. In Proceedings of ACM conference on Ubiquitous Computing (UbiComp 2008), Seoul, Korea. ACM Press: 312-321.
[3] Yu Zheng, Xing Xie, Wei-Ying Ma, GeoLife: A Collaborative Social Networking Service among User, location and trajectory. Invited paper, in IEEE Data Engineering Bulletin. 33, 2, 2010, pp. 32-40.

Thanks Anita, as usual most valued info
Looks like Partyrender ;-) http://wiki.openstreetmap.org/wiki/Party_render
You’re right, it looks similar :)
Could you please recommend a way to put the png into a video? I used Movie Maker but I have problem with the video resolution and to what speed I should use for the time laps.
What tools are you using for htis
I use the command line tool mencoder or Movie Maker. Both work fine.
Reblogged this on GIS Digest and commented:
This is awesome staff I’ll be keen to work with moving forward
Hi, I tried it out with two markers, but are not able to leave traces……
… details?
Hi Anita, 1st of all – I am from a Tourism department (FH-Salzburg) and therefore a GIS-newbie. I use QGIS 2.8.2 and the latest Time Maker plugin. I played around with Time maker and managed to create a movie -according to your tutorial above, I tried out to create two symbol layers. One layer presents the current movements, but if I got you right, the second layer should stay visible (trace). Now I don´t know which different settings are needed, so that the traces stay visible. Here is a short video of what I did so far: https://www.youtube.com/watch?v=2MGl0aG-hWg&index=6&list=PL1CB484A9AEBC3693
Hope this helps? mit lieben Grüßen aus Salzburg
Roman
This video is probably better than the one in my previous post: https://www.youtube.com/watch?v=s-PGLo3qs_k&feature=youtu.be
Please have a look at the examples from the QGIS2015 workshop https://goo.gl/A66g6D, especially the Geolife example which covers exactly this topic.
Hi Anita, I’m organizing a QGIS User Group in Seattle, Washington, and I’d like to present your trajectory/fadeout to the group at our next meeting. I downloaded your Geolife example data, opened geolife-final.qgs (I have QGIS 2.10.1 and Spatialite), and loaded fading-trajectories.qml.
Unfortunately, I don’t get the fading effect. But your article mentions an expression that will create the fading effect. Where do I put that extension to get the fading effect? Thanks in advance! Stu
Hi Stu,
There was a tiny change between 2.8 and 2.10 which unfortunately broke the fadeout styles. You can get an updated version of the project file from https://drive.google.com/file/d/0Bwc-5JFVTnfIMGR5eWoxV0tRaVk/view?usp=sharing
Thanks, Anita. The updated versions works great. I’ll be sharing it tonight with the QGIS user group, psqgis.org.
HI Anita,
I’m trying to use this expression to animate locations from a book. The book is quite densely packed with locational references which have been extracted using the Edinburgh Geoparser into a csv file. I’d like to show how these locations shift through the book, but I’m anticipating that these locations will shift quite dramatically at times so being able to have a marker that gradually fades will help make the visual less jarring. I’d initially tried a heatmap, which looks good but this will also suffer from jumping around and being hard to follow. There seems to be no way to fade this so I am using the points
The time reference I am using is the page number (1 to 303), which I am converting into seconds (e.g. Page 1 = 1970-01-01 00:00:01 etc.) and storing in a column called “date”. The data is still in a csv which I have added using lat lon columns.
At the moment I only have a sample data set of the first few pages, which I have doctored to give them a better time spread, 6 locations at 5 time points.
The points display as expected in each time-slice; the code for the fade throws no errors, but the fade effect only occurs when I switch off Time Manager. I have changed my “Time frame size” to 1 second to see the points appear, but I think everything else is as you have in the Geolife example.
I did try altering the expression like this:
color_hsv(
311,
scale_exp(
minute(age(animation_datetime(),”date”)),
0,60,
100,0,
0.2
),
90
)
but that had no effect.
I’m way out of my depth here, but it would be really good to show English Literature students what can be achieved. I am probably missing something quite obvious here, any advice would be much appreciated.
For the fade effect, you need to activate the accumulate features option by setting the End time to “No end time – accumulate features” in the time layer settings.