Time Manager 1.6 – now with feature interpolation
Over the last couple of weeks, Karolina has been very busy improving and expanding Time Manager. This post is to announce the 1.6 release of Time Manager which brings you many fixes and exciting new features.
What’s this feature interpolation you’re talking about?
Interpolation is really helpful if you have multiple observations of the same (moving) real-world object at different points in time and you want to visualize the movement between the observations. This can be used to visualize animal paths, vehicle tracks, or any other movement in space.
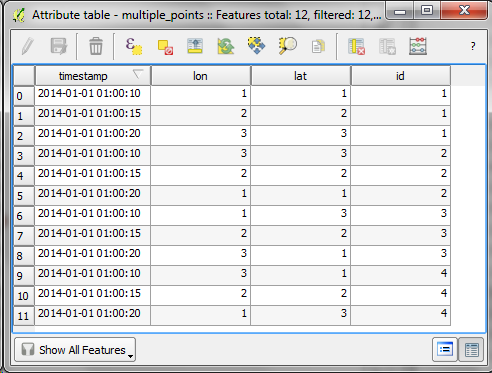
The following example shows a simple layer which contains 12 point features (3 for each id value).
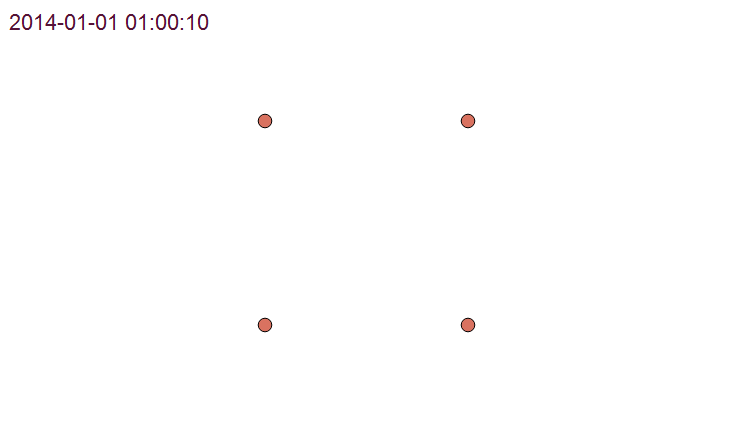
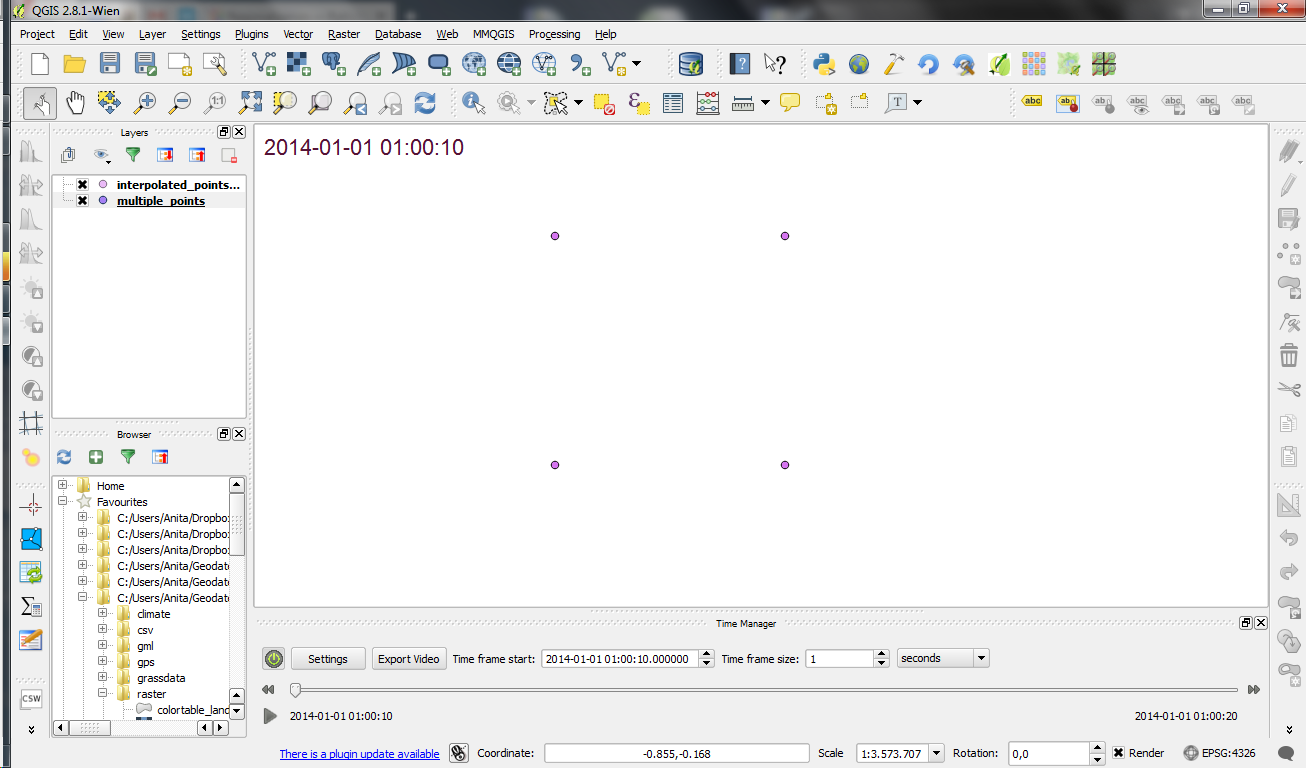
Using Time Manager interpolation, it is easy to create animations with interpolated positions between observations:
How is it done?
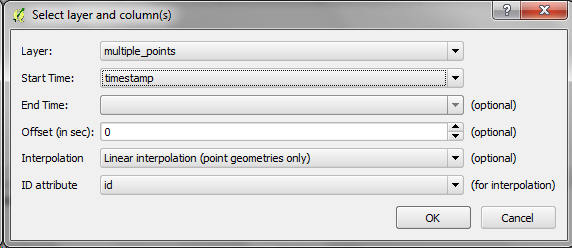
When you open the Time Manager 1.6 Settings | Add layer dialog, you will find a new option for interpolation settings. This first version supports linear interpolation of point features but more options might be added in the future. Note how the id attribute is specified to let Time Manager know which features belong to the same real-world object.
For the interpolation, Time Manager creates a new layer which contains the interpolated features. You can see this layer in the layer list.
I’m really looking forward to seeing all the great animations this feature will enable. Thanks Karolina for making this possible!

Nice plugin, but I cannot get it working with my data. Is it only possible with points? I have parcels (polygon) with a year as attribute.
The general functionality of the plugin works with any geometry type. Only the interpolation is limited to points as described in the post.
Hi, thx! I try this plug-in with a lot of data https://youtu.be/IM4uZThl6v8
Thanks for sharing this great example.
I got it working. I had to transfer the year (like 1622) into a date like 1622-01-01 (done with Super tools in Google sheets). So only a ‘year’ doesnt do the job.
This is the result: city development from 16th till 21st century in the town Voorburg in the Netherlands:
Thanks for sharing! Very nicely done.