Archive

QGIS

Have you ever wondered how to comfortable visualize PostGIS queries? Meet “RT Sql Layer” a powerful and comfortable QGIS plugin that allows building and visualizing queries on your PostGIS data.

RT Sql Layer comes with a graphic query builder:

RT Sql Layer Query Builder dialog

It allows saving/loading of queries to speed up your work flow.

The query results will be loaded as a new layer:

Loaded query layer

RT Sql Layer is available through Faunalia Plugin Repository.

For another great example on what can be achieved with this plugin, read Carson Farmer’s post on “pgRouting, OpenStreetMap, and QGIS” where he describes how to build your own routing database and visualize routing results in QGIS with RT Sql Layer.

More on RT Sql Layer: How to create Point Layers from x/y Data on the fly with PostGIS and QGIS

For a while now, QGIS releases have been named after moons. This will change with the next release 1.6:

All releases from 1.6 forward will be named after a place on earth, preferably a very obscure place with an interesting story behind it.

You can submit your name suggestions on the QGIS Wiki page.

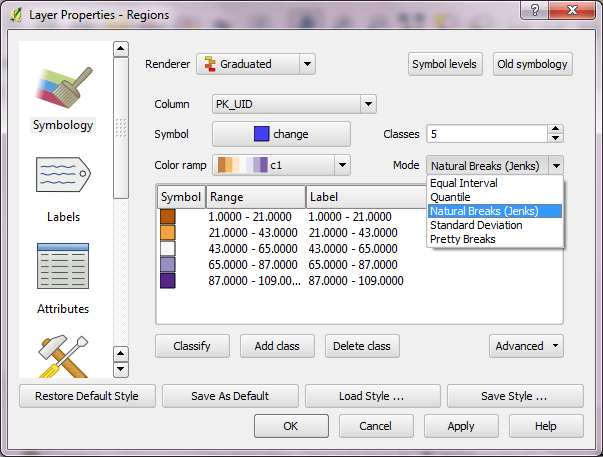
Carson Farmer has written some new classification functions for QGIS. QGIS 1.5 only has “Equal Interval” and “Quantiles” classification algorithms implemented. Carson added the following algorithms to trunk:

  • Jenks Optimisation (or Natural Breaks)
  • Standard Deviation
  • R’s “Pretty” algorithm
QGIS classification algorithms

QGIS classification algorithms for layer symbology in current QGIS trunk version

Read more on his blog: “Playing around with classification algorithms: Python and QGIS” and “Adding a bit of class(ification) to QGIS…”

The aim of Time Manager plugin for QGIS is to provide comfortable browsing through temporal geodata. A dock widget provides a time slider and a configuration dialog for your layers to manage.

a wildlife telemetry dataset managed by Time Manager

Time Manager filters your vector datasets and displays only features with timestamps in the user specified time frame.

two views of the scenery, using a two-days time frame

Give it a try! The project website can be found at http://anitagraser.github.com/TimeManager/.

You can call almost any function in Python, using “grass.run_command(“function”, ….)”.

For your inspiration, you find GRASS Python scripts in their SVN.

Great news everyone: Since revision r14172, QGIS supports non-spatial tables! This means you can finally load your CSV files directly into QGIS and work with them, e.g. use “Join by attribute”.

Loading the CSV file is performed using “Add Vector layer”. (Yes, the terminology is a little confusing here.) The resulting layer will be shown in the legend list and the content can be view via attribute table.

Great work Marco!

While this is not a new addition to QGIS anymore – in fact it has been around since 1.4 – I feel it’s not as widely know as it should be: QGIS offers the power of ColorBrewer to create color ramps! And this is how you get to use this power:

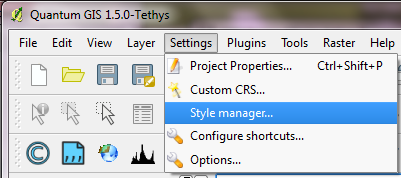
All styles: marker, line, fill and color ramps can be accessed via “Style manager”:

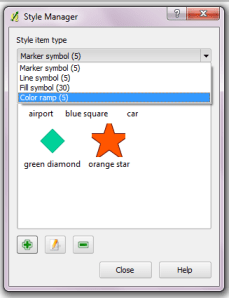
In Style Manager you can add, edit and delete styles:

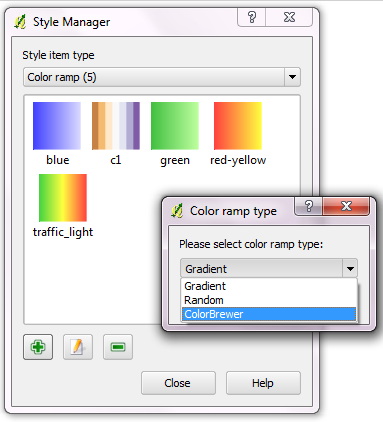
When creating a new color ramp, you get to choose between “Gradient”, “Random” and finally “ColorBrewer” ramp type. (By the way: You can create multi-color color ramps if you choose “Gradient”.)

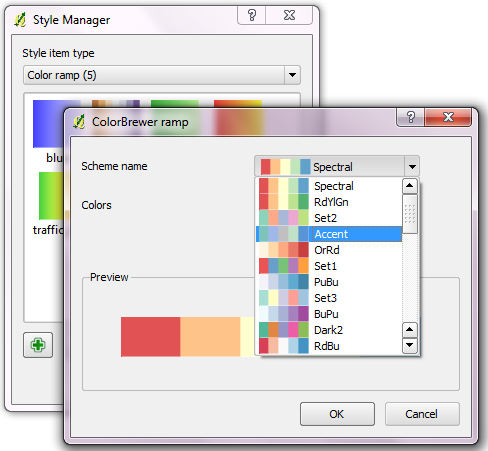
When creating a ColorBrewer ramp, you can choose from various schemes and define how many colors your ramp should contain:

I love these new ramps and I wish I’d have discovered them sooner :)

Enjoy the power of ColorBrewer and QGIS!

QGIS Mapserver is now in QGIS trunk. Check Linfiniti Geo Blog to learn how to set it up and just how powerful this new server is. We’re all looking forward to see how QGIS Mapserver performs compared to older projects like UMN Mapserver and Geoserver at the WMS Benchmarking in Barcelona.


This year’s Google Summer of Code project for QGIS “QGIS on Steroids” has come to an successful end. The resulting improvements are currently available through http://svn.osgeo.org/qgis/branches/threading-branch/ and will be available in trunk after more testing.

Read Martin’s full report on QGIS wiki.

The QGIS Community Team proudly presents three new QGIS user reports aka Case Studies:

“… I realized that QGIS was the only one which can connect to WMS, WCS and WFS successfully.”

“I found that QGIS provided a very intuitive interface for GRASS, hat they complemented each other perfectly, and they provided all the analytical capabilities I needed.”

“The most important qualities of QGIS are the intuitive user interface and the compatibility with different file formats. It is an ideal tool for projects that are on one hand based on existing geographic data and on the other hand require the acquisition of new data.”

If you would like to share your own story, just contact the QGIS community team. All contributions welcome!