Movement data in GIS #2: visualization
In the first part of the Movement Data in GIS series, I discussed some of the common issues of modeling movement data in GIS, followed by a recommendation to model trajectories as LinestringM features in PostGIS to simplify analyses and improve query performance.
Of course, we don’t only want to analyse movement data within the database. We also want to visualize it to gain a better understanding of the data or communicate analysis results. For example, take one trajectory:
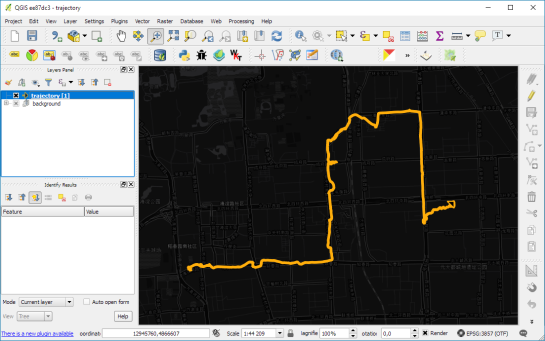
(data credits: GeoLife project)
Visualizing movement direction is easy: just slap an arrow head on the end of the line and done. What about movement speed? Sure! Mean speed, max speed, which should it be?
Speed along the trajectory, a value for each segment between consecutive positions.
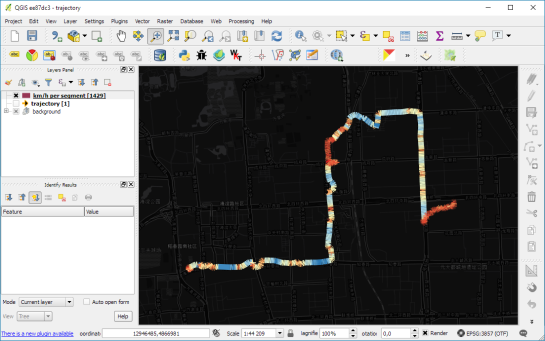
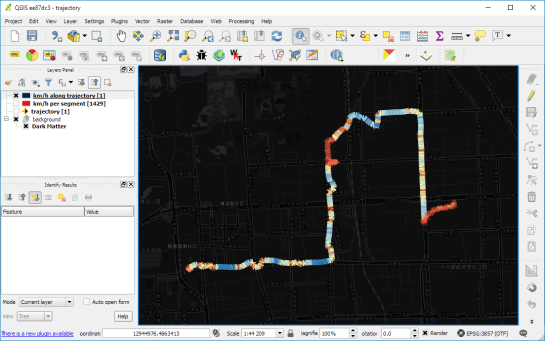
With the usual GIS data model, we are back to square one. A line usually has one color and width. Of course we can create doted and dashed lines but that’s not getting us anywhere here. To visualize speed variations along the trajectory, we therefore split the original trajectory into its segments, 1429 in this case. Then we can calculate speed for each segment and use a graduated or data defined renderer to show the results:
Very unsatisfactory! We had to increase the number of features 1429 times just to show speed variations along the trajectory, even though the original single trajectory feature already contained all the necessary information and QGIS does support geometries with measurement values.
Starting from QGIS 2.14, we have an alternative way to deal with this issue. We can stick to the original single trajectory feature and render it using the new geometry generator symbol layer. (This functionality is also used under the hood of the 2.5D renderer.) Using the segments_to_lines() function, the geometry generator basically creates individual segment lines on the fly:
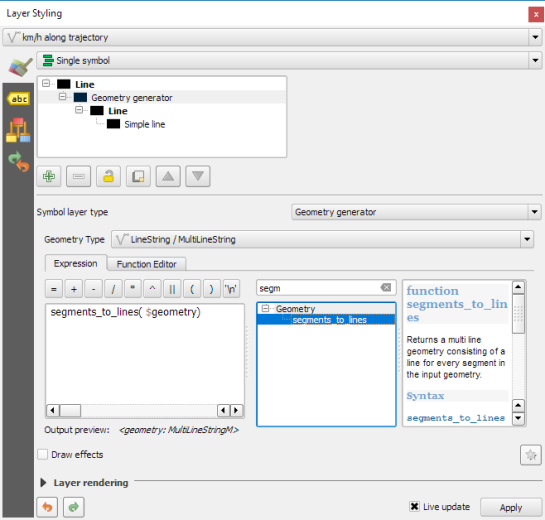
Segments_to_lines( $geometry) returns a multi line geometry consisting of a line for every segment in the input geometry
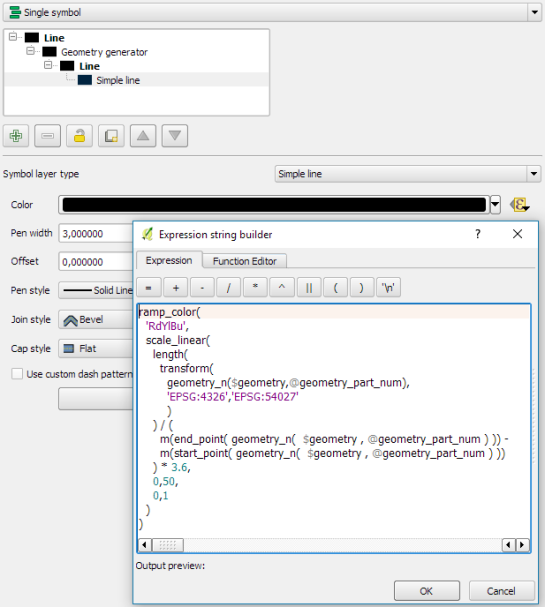
Once this is set up, we can style the segments with a data-defined expression that determines the speed on the segment and returns the respective color along a color ramp:
Speed is calculated using the length of the segment and the time between segment start and end point. Then speed values from 0 to 50 km/h are mapped to the red-yellow-blue color ramp:
ramp_color(
  'RdYlBu',
  scale_linear(
    length(
      transform(
	    geometry_n($geometry,@geometry_part_num),
		'EPSG:4326','ESRI:54027'
		)
    ) / (
      m(end_point(  geometry_n($geometry,@geometry_part_num))) -
      m(start_point(geometry_n($geometry,@geometry_part_num)))
    ) * 3.6,
    0,50,
    0,1
  )
)
Thanks a lot to @nyalldawson for all the help figuring out the details!
While the following map might look just like the previous one in the end, note that we now only deal with the original single line feature:
Similar approaches can be used to label segments or positions along the trajectory without having to break the original feature. Thanks to the geometry generator functionality, we can make direct use of the LinestringM data model for trajectory visualization.
This post is part of a series. Read more about movement data in GIS.
Very informative.I like the flow and the well written guide.Thanks