Archive

QGIS

This post shows how to quickly and easily create a small QGIS plugin for counting the number of features within a vector layer.

To get started, you will need QGIS and Qt Designer (to design the user interface) installed. If you are on Windows, I suggest WinPython which provides Qt Designer and Spyder (a Python IDE).

The great thing about creating plugins for QGIS: There is a plugin for that! It’s called Plugin Builder. And while you are at it, also install Plugin Reloader. Reloader is very useful for plugin developers because it lets you quickly reload your plugin without having to restart QGIS every time you make changes to the code.

installPluginBuilder

Plugin Builder will create all the files we need for our plugin. Just start it and select a name for your plugin class (one word in CamelCase), as well as a name for the plugin itself and the plugin menu entry (can be multiple words). Once you press Ok, you’re asked to select a folder to store the plugin. You can save directly to the QGIS plugin folder ~\.qgis2\python\plugins.

pluginBuilder

Next, open the newly created folder (in my case ~\.qgis2\python\plugins\BuilderTest). Amongst other files, it contains the user interface file ui_buildertest.ui. Our plugin will count the number of features in a vector layer. Therefore, it needs a combobox which allows the user to select a layer. Open the .ui file in Qt Designer and add a combobox to the dialog. Change the object name of the combobox to layerCombo. We’ll later use this name in the plugin code to add items to the combobox. Save the dialog and close Qt Designer.

qtDesigner

Now, we need to compile the .ui and the resources.qrc file to turn the dialog and the icon into usable Python code. This is done on the command line. On Windows, I suggest using the OSGeo4W Shell. Navigate to the plugin folder and run:

pyuic4 -o ui_buildertest.py ui_buildertest.ui
pyrcc4 -o resources_rc.py resources.qrc

Note: Using the latest version of Plugin Builder, you only need to compile resources.qrc because the .ui is now loaded dynamically. Furthermore, you should use the following command to compile the resources:

pyrcc4 -o resources.py resources.qrc 

If you enable and run the plugin now, you will already see the dialog but the combobox will be empty. To populate the combobox, we need to write a few lines of code in buildertest.py. First, we’ll fetch all loaded layers and add all vector layers to the combobox. Then, we’ll add code to compute and display the number of features in the selected layer. To achieve this, we expand the run() method:

def run(self):        
    # show the dialog
    self.dlg.show()

    layers = QgsMapLayerRegistry.instance().mapLayers().values()
    for layer in layers:
        if layer.type() == QgsMapLayer.VectorLayer:
            self.dlg.layerCombo.addItem( layer.name(), layer ) 
         
    # Run the dialog event loop
    result = self.dlg.exec_()
    # See if OK was pressed
    if result == 1:
        # do something useful 
        index = self.dlg.layerCombo.currentIndex()
        layer = self.dlg.layerCombo.itemData(index)
        QMessageBox.information(self.iface.mainWindow(),"hello world","%s has %d features." %(layer.name(),layer.featureCount()))

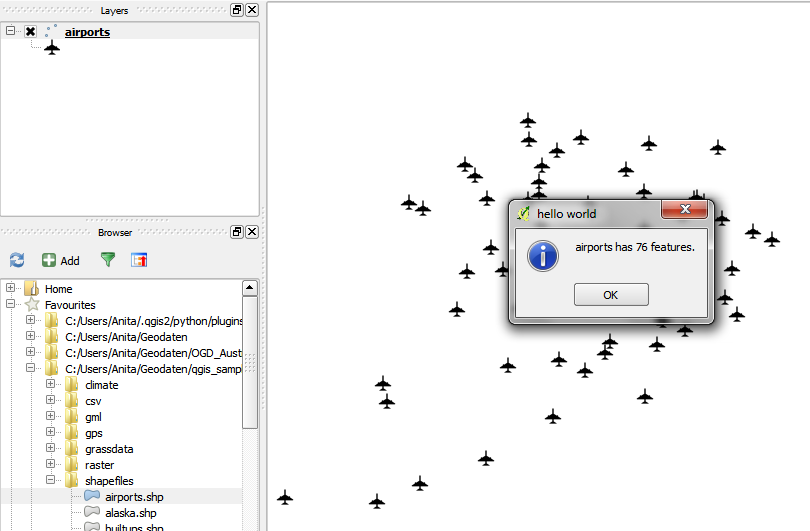
When you are done with the code, you can use Plugin Reloader to load the new version. When you start the plugin now, the combobox will be populated with the names of the vector layers in your current project. And on pressing Ok, the plugin will compute and display the number of features.

builderTEst

builderTestResult

For more information on PyQGIS and more code samples I warmly recommend the PyQGIS Cookbook. Have fun!

Extracting POIs from OpenStreetMap is reasonably simple using Overpass API. A very convenient way to construct the query is to use a query builder which allows you to select the area of interest and builds queries for different servers.

xapi_query_builder

Of course you can fine-tune the query further. For example, you can add multiple key-value pairs to the query. I used the following query to select all Billa supermarkets:

www.overpass-api.de/api/xapi?*[shop=supermarket][name=Billa][bbox=15.96725,48.0432,16.79947,48.40915]

Note the * in the query? It means that I’m querying all kinds of features: nodes, ways, and relations.

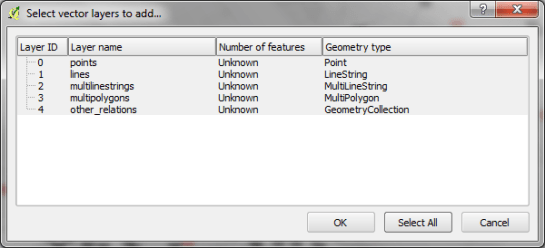
Save the server response to a .osm file. This file can be loaded into QGIS using simple drag-and-drop or Add Vector Layer. A dialog will open where you can select the type of features you want to load from the file. You can simply use Select All and OK to load everything.

add_osm_file

My supermarket POIs came in two types: points and multipolygons. To style them both with nice supermarket SVG icons, I decided to use a Centroid fill with the SVG marker for the polygon layer:

osm_pois_billa

Open data and open source GIS … nice :-)

Today was the last day of the Vienna code sprint which brought together OSGeo developers from many projects. It’s been a great week thanks to organizers and sponsors!

The QGIS team was extremely busy working on the project’s web infrastructure (e.g. new plugins.qgis.org website) as well as hunting down and fixing bugs.

Check out some impressions on twitter.

qgis23_vienna

More pictures on the official blog: vienna2014.sprint.osgeo.org

If you are looking for a tool to easily create 3D visualizations of your geodata, look no further! Qgis2threejs is a plugin by Minoru Akagi which exports terrain data combined with the map canvas image and optional vector data to an html file which can be viewed in 3D in any web browser which supports WebGL. To do that, this plugin uses the Three.js library.

This is the result of my first experiments with Qgis2threejs. In the following sections, I will show the steps to reproduce it.

Türkenschanzpark, Vienna

click for the interactive version (requires WebGL-capable browser)

1. The data

The building blocks of this visualization are:

  • elevation data and the hillshade derived from this data
  • a base map (WMTS from basemap.at in my case)
  • OSM building data provided by Geofabrik and
  • tree data from the city of Vienna

Load all datasets into QGIS.

2. Preparing the map

Qgis2threejs will overlay the map (as rendered in the QGIS map area) on top of the elevation model. You can combine any number of layers to create your map. I just loaded a basemap.at WMTS and a hillshade layer. To add a nice tree shadow effect, I also added the tree layer (dark grey, 50% transparency, multiply blending).

tuerkenschanzpark_map

3. Preparing the vector features

The vector features in the visualization are buildings and trees. The buildings are based on an OSM building layer. The trees are create from two point layers: one point layer to create the tree trunks (cylinder shape) and a duplicate of this point layer to create the tree crowns (sphere shape).

Load the data and choose the desired fill colors.

4. Using Qgis2threejs

Now we can start Qgis2threejs. The first tab is used to configure the terrain. Just pick the correct elevation data layer. I didn’t modify any of the other default settings.

qgis2threejs_dem

The second tab provides the settings for the vector data. As mentioned in the previous section, the trees are created from two point layers and the buildings are based on a polygon layer. The tree crowns are spheres with a radius size 3 and a z value of 5 above the surface. The tree trunks are cylinders. Finally, the buildings have a height of 10.

qgis2threejs_vector

That’s it! Just press “run” and wait. When the export is finished, your default browser (or a different one, if you specify another one in the plugin settings) will open automatically and display the results.
The visualization is interactive. You can tilt the visualization using the left mouse button, pan using the right mouse button, and zoom using the mouse wheel. I found that Firefox used around 1.6 GB of RAM to render this example.

5. Share your visualization

In the browser window, you will see where Qgis2threejs stored the html and associated Javascript files. To share your visualization, you just need to copy these files onto a webserver.

I would love to see what you come up with. Please share a link in the comments.

QGIS 2.2 is now available for Windows through OSGeo4W installer. Packages for other systems are being prepared by the package maintainers.

The Windows packages are currently marked experimental, so you have to use the advanced install in OSGeo4W and check the ‘Exp’ radio button on the top to install them.

osgeo4w_qgis22

As release manager Jürgen Fischer announced:

Please test and report problems, so that I can soon promote them to ‘curr’ent.
Once that has happend, I’ll proceed with turning them into standalone
installers.

QGIS 2.2 will be released tomorrow, February 21st. Following the release of 2.0, the QGIS project decided to move to a time-based release plan with releases every four months. This provides a clear framework for developers, translators and documenters which makes it possible to plan ahead and know when tasks have to be finished to be included in a release version.

Similar to the 2.0 release, the project has invested considerable resources to make 2.2 “Valmiera” a successful release. I have already blogged about some of the great new features. Thanks to the project donors and sponsors it was also possible to fund developer time for many important bug fixes.

One of the greatest resources of the QGIS project are its users. One group that deserves our special thanks is the Swiss QGIS User Group. They collect a modest annual membership fee which provides a steady and growing crowd-funding that can be used to positively influence the QGIS project. For example, they invested in bug fixing for 2.0 and they are co-funding work on multi-threaded rendering for QGIS 2.4.

With the rise of new QGIS user groups “QUGs” all around the world, e.g. in Australia, the UK, and the US, I hope these groups will find ways to bring users together and to positively influence the development of QGIS towards the next releases.

With the major release of version 2.0, QGIS is once more returning to a fast release cycle. You can find the project road map on qgis.org. The QGIS 2.2 release is scheduled for Feb, 21st and we are already in feature freeze. This means that now is the time to get the nightly version, do some testing and report possible bugs before the new version is being shipped.

Like for version 2.0, the QGIS team has prepared a great visual change log listing many new features. For me, one of the feature highlights is the possibility to export maps with world files from Print Composer because it means that we can finally create high-resolution, georeferenced images comfortably from within the application.

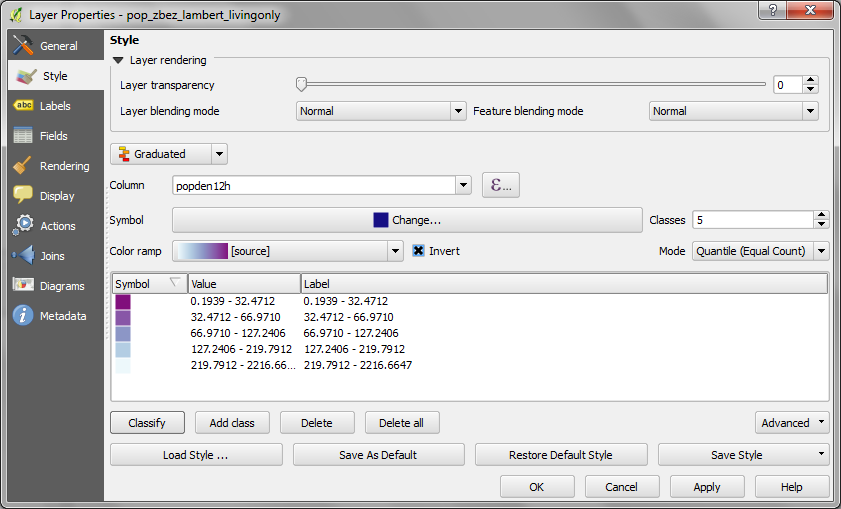
Another feature which will help save a lot of time is the ability to invert color ramps. So far, we had to recreate the color ramp or use work-arounds involving expression-based color settings to achieve the same effect.

invertcolorramp

These are just my personal favorites. If you haven’t checked out the change log yet, I certainly encourage you to have a look and decide for yourself. Also, if you find the time, please help by testing and reporting any issues you encounter. This way, we can all help to make 2.2 another successful release.

OSM place search and osmSearch are two plugins for QGIS which use the Nominatim service to find addresses and places. They are both still marked as “experimental” plugins, so users are expected to expect the unexpected.

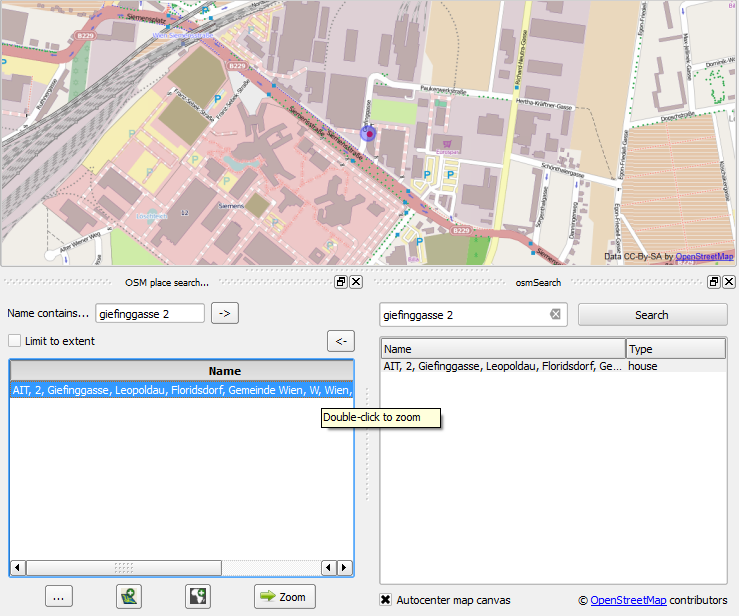
Once installed, both plugins look very similar: There is an input text field and a results list.

osmsearch_giefinggasse

A simple search with street name and house number returns the expected results. Interacting with the result shows some differences:

  • OSM place search will highlight the location when you mouse-over the result in the list. On double-click, it will zoom to the result.
  • osmSearch will highlight the result and move the map center to the result if you double-click but won’t zoom.

Both plugins can deal with umlauts (ä,ö,ü) but only osmSearch works with háčeks.

osmsearch_hacek

A nice feature of osmSearch is that it remembers your previous searches and offers an auto-complete function.

OSM place search on the other hand offers a reverse “Where am I” function (the arrow pointing to the left” which tries to find a name for the current map center location. Additionally, there are functions to add the current object as a new layer or mask layer.

Both plugins have strong and weak points. Combined, they would make a really strong tool but then nothing prevents us from having them both and choosing the best one for the task at hand.

Profile Tool is a plugin for QGIS which makes it possible to generate (elevation) profiles for line features. The plugin is available through the default QGIS plugin repository. While testing the plugin, I found some aspects of using the tool might require additional instructions.

After installing and enabling the plugin, you will find the “Terrain profile” button in the plugin toolbar:

qgisprofiletool

The basic use case is as follows:

  1. Load the elevation raster and select this raster layer in the layer list.
  2. Press the “Terrain profile” button. This opens the plugin panel which consists of a graph area on the left and a raster layer list on the right. The raster layer you had selected will be added to the raster layer list.
  3. If you have “Selection: Temporary polyline” enabled, you can now draw a line in the map area. Double-click left to end drawing the line. (If you are paying close attention, you might have noticed the instructions in the status bar.)
  4. After you have finished drawing the line, the graph area will update and display the profile.

qgisprofiletool2

If you want to add another raster layer to the plugin, you need to first select the raster layer in the QGIS layer list and then press the “Add Layer” button in the Profile Tool panel.

To generate the profile for an existing line feature, you need to change the selection mode from “Temporary polyline” to “Selected polyline”. Then you need to select the vector layer which contains the line feature you want to use in the QGIS layer list. Finally, you can click on the line feature in the map area to select it. (Note that this selection is independent of any selections you might have going on using the default QGIS feature selection tools.)

If you change from the Profile Tool to any other tool such as “Pan Map” or “Identify”, you have to click the “Terrain profile” button again to re-enable drawing/selection a line for the Profile Tool.

Due to a bug, it is currently not possible to export the profile graph. An alternative is to open the “Table” tab of the Profile Tool panel which provides access to the profile data and copy the data into your preferred graphing application such as Calc or Excel.

If you want to see the Profile Tool in action, I recommend watching the introduction video by Lene Fischer (University of Copenhagen).

Since I finally managed to download the elevation model of the city of Vienna, I thought I’d share some eye candy with you: The map uses layer blending to combine hillshade and elevation raster, and the elevation raster’s color ramp is a modified “garish14” from QGIS’ cpt-city color ramp collection.

wien_elevation by underdarkGIS
wien_elevation, a photo by underdarkGIS on Flickr.

Update

Here is how you get access to the “garish14” color ramp:

Start by selecting the "new color ramp" option in the raster's style window.

Start by selecting the “new color ramp” option in the raster’s style window.

Chose the "cpt-city" color ramp type.

Chose the “cpt-city” color ramp type.

In the "cpt-city color ramp" window, you will find lots of different premade color ramps. "garish14" is part of the "Topography" collection.

In the “cpt-city color ramp” window, you will find lots of different premade color ramps. “garish14” is part of the “Topography” collection.