Archive

QGIS

tldr; Tired of working with large CSV files? Give GeoParquet a try!
“Parquet is a powerful column-oriented data format, built from the ground up to as a modern alternative to CSV files.” https://geoparquet.org/

(Geo)Parquet is both smaller and faster than CSV. Additionally, (Geo)Parquet columns are typed. Text, numeric values, dates, geometries retain their data types. GeoParquet also stores CRS information and support in GIS solutions is growing.

I’ll be giving a quick overview using AIS data in GeoPandas 1.0.1 (with pyarrow) and QGIS 3.38 (with GDAL 3.9.2).

File size

The example AIS dataset for this demo contains ~10 million rows with 22 columns. I’ve converted the original zipped CSV into GeoPackage and GeoParquet using GeoPandas to illustrate the huge difference in file size: ~470 MB for GeoParquet and zipped CSV, 1.6 GB for CSV, and a whopping 2.6 GB for GeoPackage:

Reading performance

Pandas and GeoPandas both support selective reading of files, i.e. we can specify the specific columns to be loaded. This does speed up reading, even from CSV files:

Whole fileSelected columns
CSV27.9 s13.1 s
Geopackage2min 12s 😵20.2 s
GeoParquet7.2 s4.1 s

Indeed, reading the whole GeoPackage is getting quite painful.

Here’s the code I used for timing the read times:

As you can see, these times include the creation of the GeoPandas.GeoDataFrame.

If we don’t need a GeoDataFrame, we can read the files even faster:

Non-spatial DataFrames

GeoParquet files can be read by non-GIS tools, such as Pandas. This makes it easier to collaborate with people who may not be familiar with geospatial data stacks.

And reading plain DataFrames is much faster than creating GeoDataFrames:

But back to GIS …

GeoParquet in QGIS

In QGIS, GeoParquet files can be loaded like any other vector layer, thanks to GDAL:

Loading the GeoParquet and GeoPackage files is pretty quick, especially if we zoom into a small region of interest (even though, unfortunately, it doesn’t seem possible to restrict the columns to further speed up loading). Loading the CSV, however, is pretty painful due to the lack of spatial indexing, which becomes apparent very quickly in the direct comparison:

(You can see how slowly the red CSV points are rendering. I didn’t have the patience to include the whole process in the GIF.)

As far as I can tell, my QGIS 3.38 ‘Grenoble’ does not support writing to or editing of GeoParquet files. So I’m limited to reading GeoParquet for now.

However, seeing how much smaller GeoParquets are compared to GeoPackages (and also faster to write), I hope that we will soon get the option to export to GeoParquet.

For now, I’ll start by converting my large CSV files to GeoParquet using GeoPandas.

More reading

If you’re into GeoJSON and/or PyGeoAPI, check out Joana Simoes’ post: “Navigating GeoParquet: Lessons Learned from the eMOTIONAL Cities Project”

And if you want to see a global dataset example, have a look at Matt Travis’ presentation using Overture data:

After the initial ChatGPT hype in 2023 (when we saw the first LLM-backed QGIS plugins, e.g. QChatGPT and QGPT Agent), there has been a notable slump in new development. As far as I can tell, none of the early plugins are actively maintained anymore. They were nice tech demos but with limited utility.

However, in the last month, I saw two new approaches for combining LLMs with QGIS that I want to share in this post:

IntelliGeo plugin: generating PyQGIS scripts or graphical models

At the QGIS User Conference in Bratislava, I had the pleasure to attend the “Large Language Models and GIS” workshop presented by Gustavo Garcia and Zehao Lu from the the University of Twente. There, they presented the IntelliGeo Plugin which enables the automatic generation of PyQGIS scripts and graphical models.

The workshop was packed. After we installed all dependencies and the plugin, it was exciting to test the graphical model generation capabilities. During the workshop, we used OpenAI’s API but the readme also mentions support for Cohere.

I was surprised to learn that even simple graphical models are actually pretty large files. This makes it very challenging to generate and/or modify models because they take up a big part of the LLM’s context window. Therefore, I expect that the PyQGIS script generation will be easier to achieve. But, of course, model generation would be even more impressive and useful since models are easier to edit for most users than code.

Image source: https://github.com/MahdiFarnaghi/intelli_geo

ChatGeoAI: chat with PyQGIS

ChatGeoAI is an approach presented in Mansourian, A.; Oucheikh, R. (2024). ChatGeoAI: Enabling Geospatial Analysis for Public through Natural Language, with Large Language Models. ISPRS Int. J. Geo-Inf., 13, 348.

It uses a fine-tuned Llama 2 model in combination with spaCy for entity recognition and WorldKG ontology to write PyQGIS code that can perform a variety of different geospatial analysis tasks on OpenStreetMap data.

The paper is very interesting, describing the LLM fine-tuning, integration with QGIS, and evaluation of the generated code using different metrics. However, as far as I can tell, the tool is not publicly available and, therefore, cannot be tested.

Image source: https://www.mdpi.com/2220-9964/13/10/348

Are you aware of more examples that integrate QGIS with LLMs? Please share them in the comments below. I’d love to hear about them.

Today marks the release of Trajectools 2.3 which brings a new set of algorithms, including trajectory generalizing, cleaning, and smoothing.

To give you a quick impression of what some of these algorithms would be useful for, this post introduces a trajectory preprocessing workflow that is quite general-purpose and can be adapted to many different datasets.

We start out with the Geolife sample dataset which you can find in the Trajectools plugin directory’s sample_data subdirectory. This small dataset includes 5908 points forming 5 trajectories, based on the trajectory_id field:

We first split our trajectories by observation gaps to ensure that there are no large gaps in our trajectories. Let’s make at cut at 15 minutes:

This splits the original 5 trajectories into 11 trajectories:

When we zoom, for example, to the two trajectories in the north western corner, we can see that the trajectories are pretty noisy and there’s even a spike / outlier at the western end:

If we label the points with the corresponding speeds, we can see how unrealistic they are: over 300 km/h!

Let’s remove outliers over 50 km/h:

Better but not perfect:

Let’s smooth the trajectories to get rid of more of the jittering.

(You’ll need to pip/mamba install the optional stonesoup library to get access to this algorithm.)

Depending on the noise values we chose, we get more or less smoothing:

Let’s zoom out to see the whole trajectory again:

Feel free to pan around and check how our preprocessing affected the other trajectories, for example:

If you downloaded Trajectools 2.1 and ran into troubles due to the introduced scikit-mobility and gtfs_functions dependencies, please update to Trajectools 2.2.

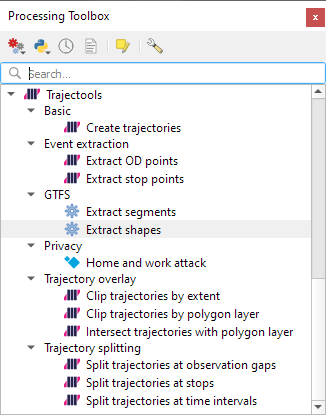
This new version makes it easier to set up Trajectools since MovingPandas is pip-installable on most systems nowadays and scikit-mobility and gtfs_functions are now truly optional dependencies. If you don’t install them, you simply will not see the extra algorithms they add:

If you encounter any other issues with Trajectools or have questions regarding its usage, please let me know in the Trajectools Discussions on Github.

Today marks the 2.1 release of Trajectools for QGIS. This release adds multiple new algorithms and improvements. Since some improvements involve upstream MovingPandas functionality, I recommend to also update MovingPandas while you’re at it.

If you have installed QGIS and MovingPandas via conda / mamba, you can simply:

conda activate qgis
mamba install movingpandas=0.18

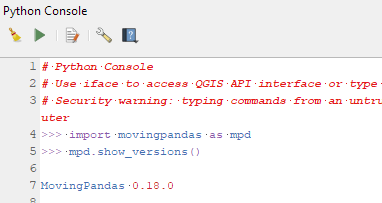
Afterwards, you can check that the library was correctly installed using:

import movingpandas as mpd
mpd.show_versions()

Trajectools 2.1

The new Trajectools algorithms are:

  • Trajectory overlay — Intersect trajectories with polygon layer
  • Privacy — Home work attack (requires scikit-mobility)
    • This algorithm determines how easy it is to identify an individual in a dataset. In a home and work attack the adversary knows the coordinates of the two locations most frequently visited by an individual.
  • GTFS — Extract segments (requires gtfs_functions)
  • GTFS — Extract shapes (requires gtfs_functions)

Furthermore, we have fixed issue with previously ignored minimum trajectory length settings.

Scikit-mobility and gtfs_functions are optional dependencies. You do not need to install them, if you do not want to use the corresponding algorithms. In any case, they can be installed using mamba and pip:

mamba install scikit-mobility
pip install gtfs_functions

MovingPandas 0.18

This release adds multiple new features, including

  • Method chaining support for add_speed(), add_direction(), and other functions
  • New TrajectoryCollection.get_trajectories(obj_id) function
  • New trajectory splitter based on heading angle
  • New TrajectoryCollection.intersection(feature) function
  • New plotting function hvplot_pts()
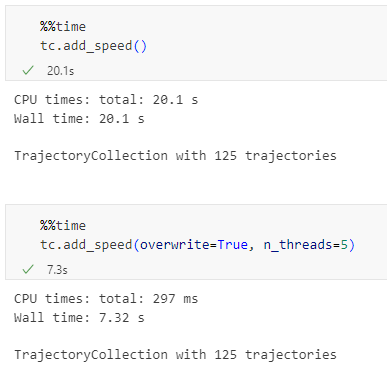
  • Faster TrajectoryCollection operations through multi-threading
  • Added moving object weights support to trajectory aggregator

For the full change log, check out the release page.

Trajectools continues growing. Lately, we have started expanding towards public transport analysis. The algorithms available through the current Trajectools development version are courtesy of the gtfs_functions library.

There are a couple of existing plugins that deal with GTFS. However, in my experience, they either don’t integrate with Processing and/or don’t provide the functions I was expecting.

So far, we have two GTFS algorithms to cover essential public transport analysis needs:

The “Extract shapes” algorithm gives us the public transport routes:

The “Extract segments” algorithm has one more options. In addition to extracting the segments between public transport stops, it can also enrich the segments with the scheduled vehicle speeds:

Here you can see the scheduled speeds:

To show the stops, we can put marker line markers on the segment start and end locations:

The segments contain route information and stop names, so these can be extracted and used for labeling as well:

If you want to reproduce the above examples, grab the open Vorarlberg public transport schedule GTFS.

These developments are supported by the Emeralds Horizon Europe project.

It’s my pleasure to share with you that Trajectools 2.0 just landed in the official QGIS Plugin Repository.

This is the first version without the “experimental” flag. If you look at the plugin release history, you will see that the previous release was from 2020. That’s quite a while ago and a lot has happened since, including the development of MovingPandas.

Let’s have a look what’s new!

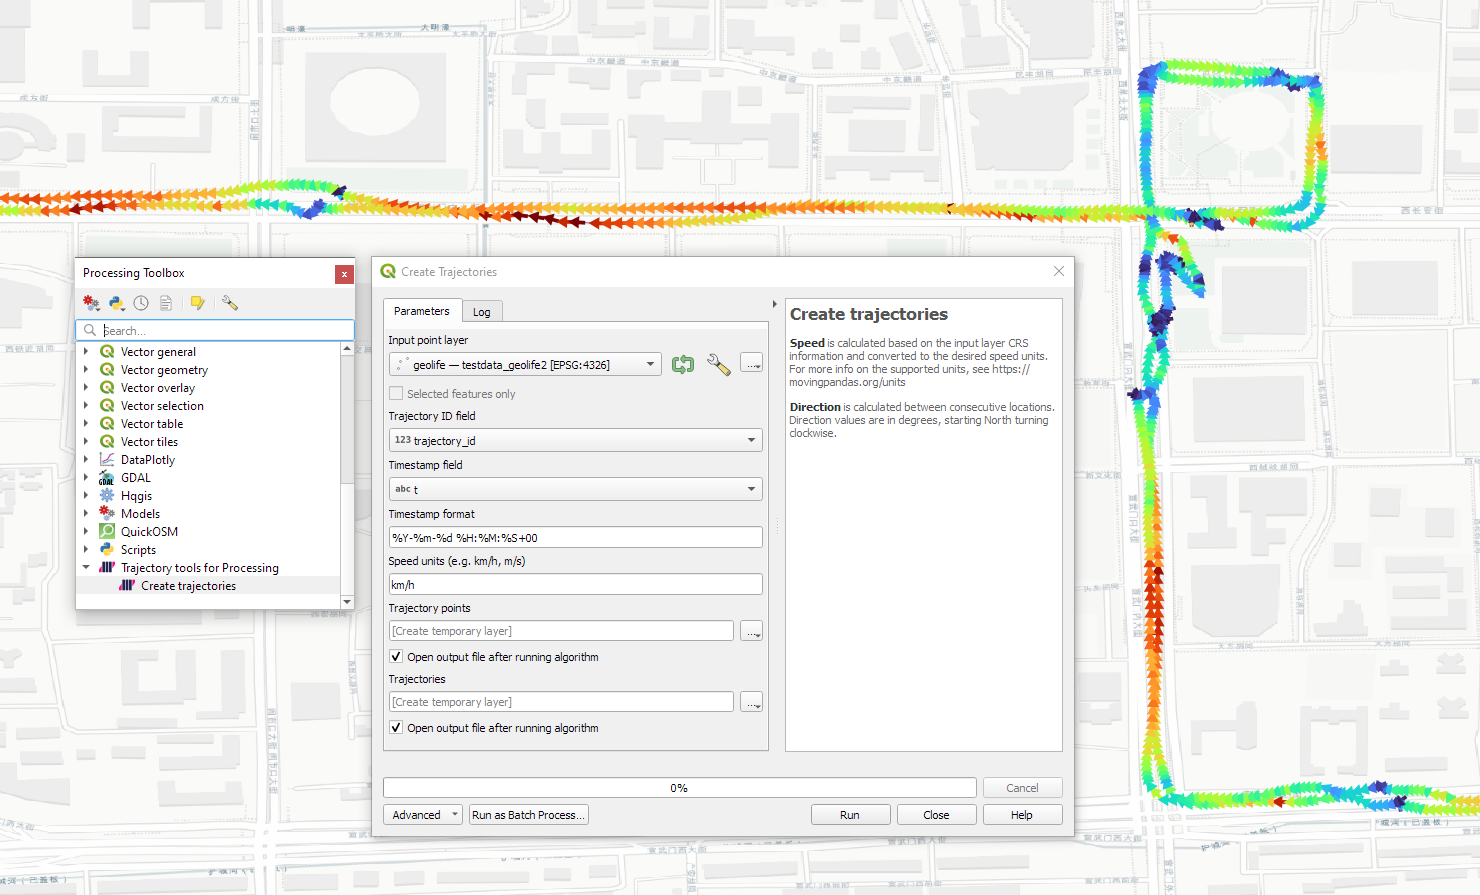
The old “Trajectories from point layer”, “Add heading to points”, and “Add speed (m/s) to points” algorithms have been superseded by the new “Create trajectories” algorithm which automatically computes speeds and headings when creating the trajectory outputs.

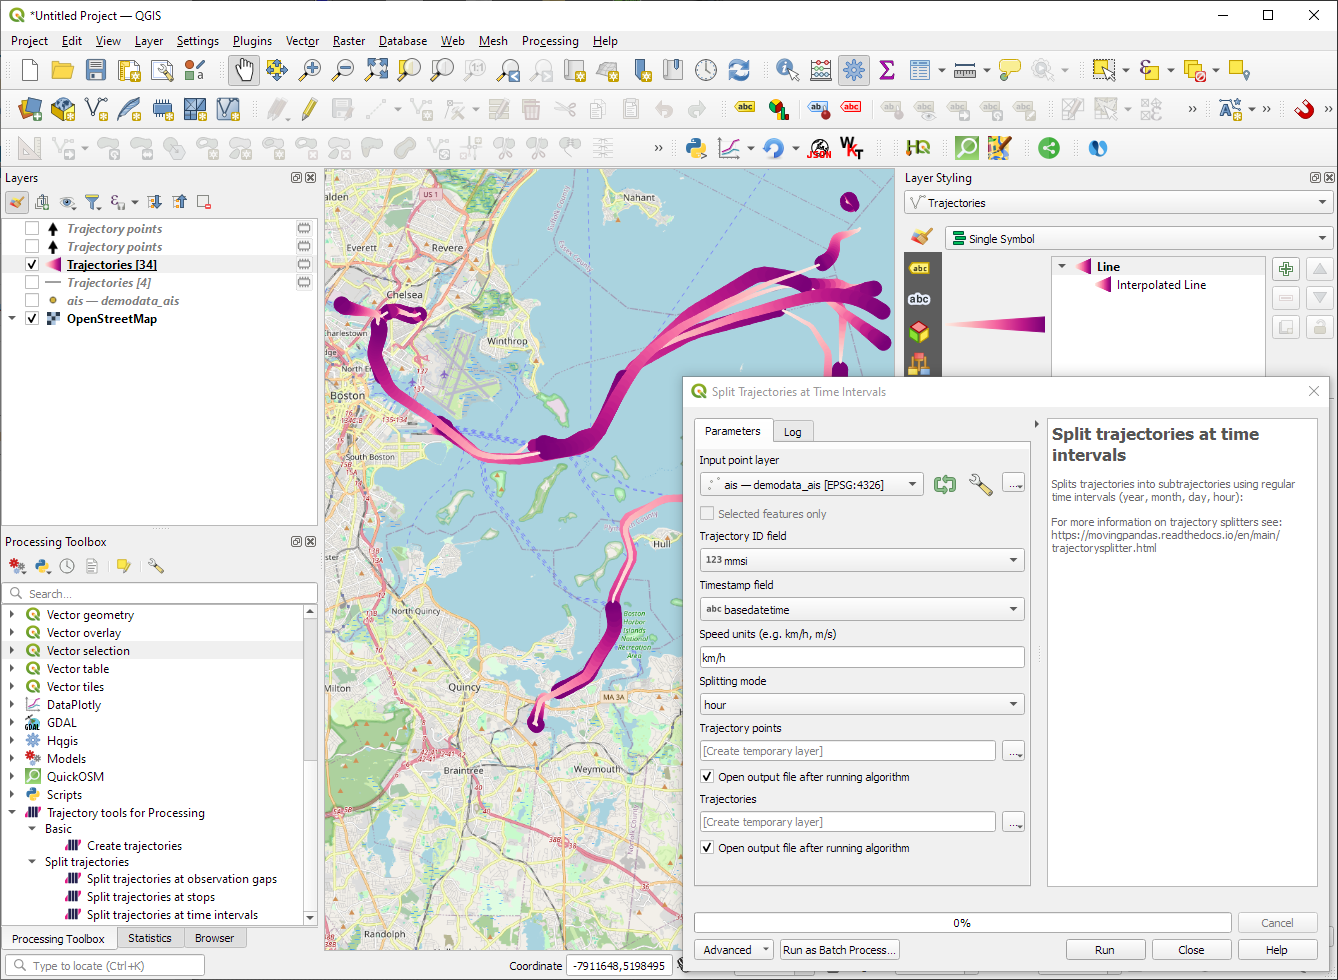
“Day trajectories from point layer” is covered by the new “Split trajectories at time intervals” which supports splitting by hour, day, month, and year.

“Clip trajectories by extent” still exists but, additionally, we can now also “Clip trajectories by polygon layer”

There are two new event extraction algorithms to “Extract OD points” and “Extract OD points”, as well as the related “Split trajectories at stops”. Additionally, we can also “Split trajectories at observation gaps”.

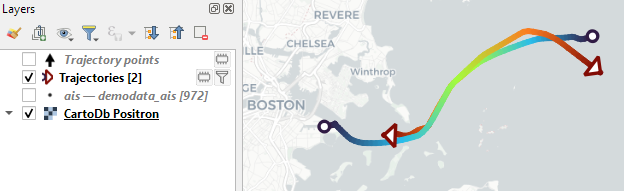
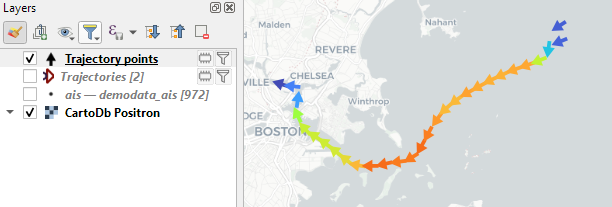
Trajectory outputs, by default, come as a pair of a point layer and a line layer. Depending on your use case, you can use both or pick just one of them. By default, the line layer is styled with a gradient line that makes it easy to see the movement direction:

while the default point layer style shows the movement speed:

How to use Trajectools

Trajectools 2.0 is powered by MovingPandas. You will need to install MovingPandas in your QGIS Python environment. I recommend installing both QGIS and MovingPandas from conda-forge:

(base) conda create -n qgis -c conda-forge python=3.9 
(base) conda activate qgis
(qgis) mamba install -c conda-forge qgis movingpandas

The plugin download includes small trajectory sample datasets so you can get started immediately.

Outlook

There is still some work to do to reach feature parity with MovingPandas. Stay tuned for more trajectory algorithms, including but not limited to down-sampling, smoothing, and outlier cleaning.

I’m also reviewing other existing QGIS plugins to see how they can complement each other. If you know a plugin I should look into, please leave a note in the comments.

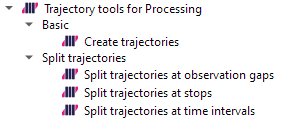
The Trajectools toolbox has continued growing:

I’m continuously testing the algorithms integrated so far to see if they work as GIS users would expect and can to ensure that they can be integrated in Processing model seamlessly.

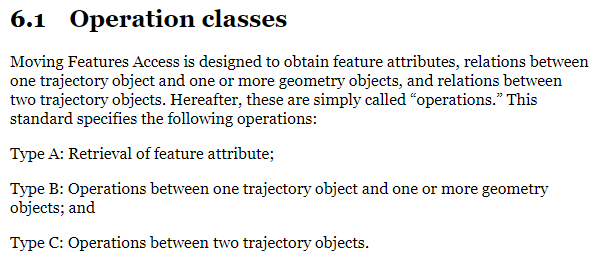
Because naming things is tricky, I’m currently struggling with how to best group the toolbox algorithms into meaningful categories. I looked into the categories mentioned in OGC Moving Features Access but honestly found them kind of lacking:

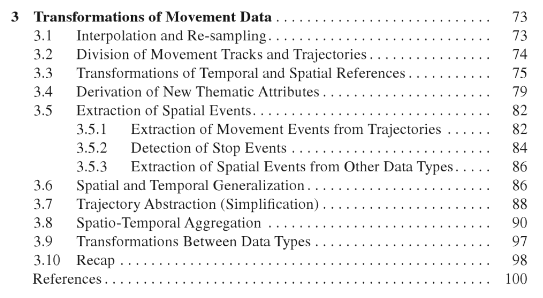
Andrienko et al.’s book “Visual Analytics of Movement” comes closer to what I’m looking for:

… but I’m not convinced yet. So take the above listed three categories with a grain of salt. Those may change before the release. (Any inputs / feedback / recommendation welcome!)

Let me close this quick status update with a screencast showcasing stop detection in AIS data, featuring the recently added trajectory styling using interpolated lines:

While Trajectools is getting ready for its 2.0 release, you can get the current development version directly from https://github.com/movingpandas/qgis-processing-trajectory.

Trajectools development started back in 2018 but has been on hold since 2020 when I realized that it would be necessary to first develop a solid trajectory analysis library. With the MovingPandas library in place, I’ve now started to reboot Trajectools.

Trajectools v2 builds on MovingPandas and exposes its trajectory analysis algorithms in the QGIS Processing Toolbox. So far, I have integrated the basic steps of

  1. Building trajectories including speed and direction information from timestamped points and
  2. Splitting trajectories at observation gaps, stops, or regular time intervals.

The algorithms create two output layers:

  • Trajectory points with speed and direction information that are styled using arrow markers
  • Trajectories as LineStringMs which makes it straightforward to count the number of trajectories and to visualize where one trajectory ends and another starts.

So far, the default style for the trajectory points is hard-coded to apply the Turbo color ramp on the speed column with values from 0 to 50 (since I’m simply loading a ready-made QML). By default, the speed is calculated as km/h but that can be customized:

I don’t have a solution yet to automatically create a style for the trajectory lines layer. Ideally, the style should be a categorized renderer that assigns random colors based on the trajectory id column. But in this case, it’s not enough to just load a QML.

In the meantime, I might instead include an Interpolated Line style. What do you think?

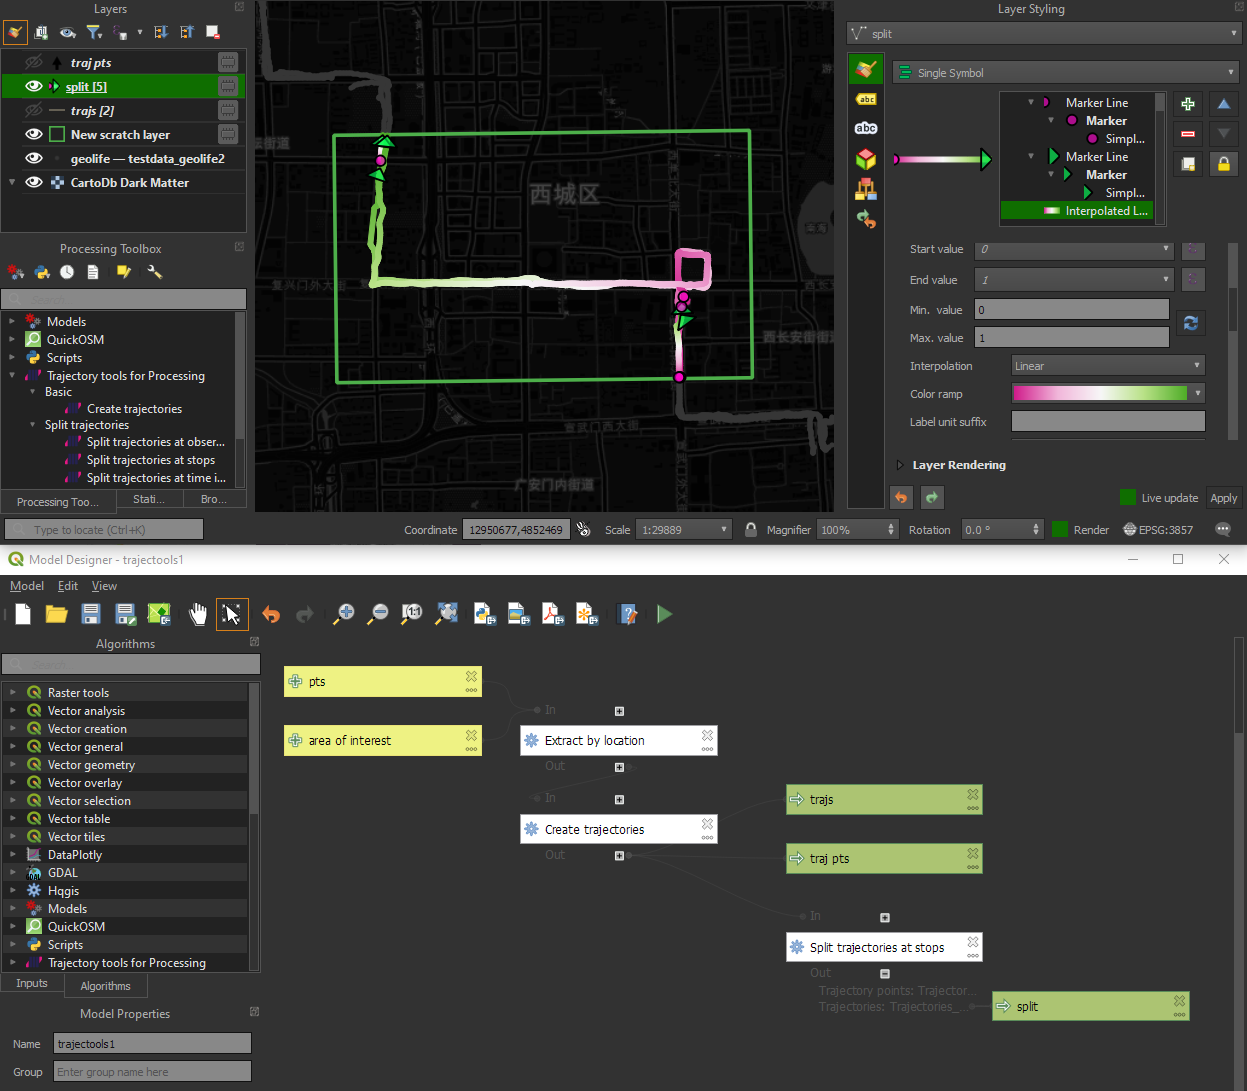
Of course, the goal is to make Trajectools interoperable with as many existing QGIS Processing Toolbox algorithms as possible to enable efficient Mobility Data Science workflows.

The easiest way to set up QGIS with MovingPandas Python environment is to install both from conda. You can find the instructions together with the latest Trajectools development version at: https://github.com/movingpandas/qgis-processing-trajectory


This post is part of a series. Read more about movement data in GIS.

Starting from 3.26, QGIS now supports .vtpk (Vector Tile Package) files out of the box! From the changelog:

ESRI vector tile packages (VTPK files) can now be opened directly as vector tile layers via drag and drop, including support for style translation.

This is great news, particularly for users from Austria, since this makes it possible to use the open government basemap.at vector tiles directly, without any fuss:

1. Download the 2GB offline vector basemap from https://www.data.gv.at/katalog/de/dataset/basemap-at-verwaltungsgrundkarte-vektor-offline-osterreich


2. Add the .vtpk as a layer using the Data Source Manager or via drag-and-drop from the file explorer


3. All done and ready, including the basemap styling and labeling — which we can customize as well:

Kudos to https://wien.rocks/@DieterKomendera/111568809248327077 for bringing this new feature to my attention.

PS: And interesting tidbit from the developer of this feature, Nyall Dawson: