Movement data in GIS #8: edge bundling for flow maps
If you follow this blog, you’ll probably remember that I published a QGIS style for flow maps a while ago. The example showed domestic migration between the nine Austrian states, a rather small dataset. Even so, it required some manual tweaking to make the flow map readable. Even with only 72 edges, the map quickly gets messy:

Raw migration flows between Austrian states, line width scaled by flow strength
One popular approach in the data viz community to deal with this problem is edge bundling. The idea is to reduce visual clutter by generate bundles of similar edges.
Surprisingly, edge bundling is not available in desktop GIS. Existing implementations in the visual analytics field often run on GPUs because edge bundling is computationally expensive. Nonetheless, we have set out to implement force-directed edge bundling for the QGIS Processing toolbox [0]. The resulting scripts are available on Github.
The main procedure consists of two tools: bundle edges and summarize. Bundle edges takes the raw straight lines, and incrementally adds intermediate nodes (called control points) and shifts them according to computed spring and electrostatic forces. If the input are 72 lines, the output again are 72 lines but each line geometry has been bent so that similar lines overlap and form a bundle.

After this edge bundling step, most common implementations compute a line heatmap, that is, for each map pixel, determine the number of lines passing through the pixel. But QGIS does not support line heatmaps and this approach also has issues distinguishing lines that run in opposite directions. We have therefore implemented a summarize tool that computes the local strength of the generated bundles.

Continuing our previous example, if the input are 72 lines, summarize breaks each line into its individual segments and determines the number of segments from other lines that are part of the same bundle. If a weight field is specified, each line is not just counted once but according to its weight value. The resulting bundle strength can be used to create a line layer style with data-defined line width:

Bundled migration flows
To avoid overlaps of flows in opposing directions, we define a line offset. Finally, summarize also adds a sequence number to the line segments. This sequence number is used to assign a line color on the gradient that indicates flow direction.
I already mentioned that edge bundling is computationally expensive. One reason is that we need to perform pairwise comparison of edges to determine if they are similar and should be bundled. This comparison results in a compatibility matrix and depending on the defined compatibility threshold, different bundles can be generated.
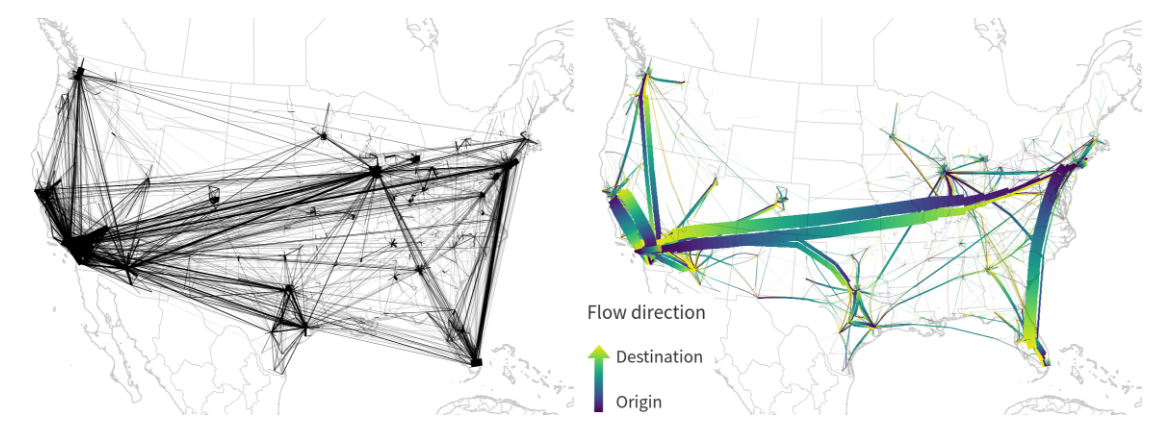
The following U.S. dataset contains around 4000 lines and bundling it takes a considerable amount of time.

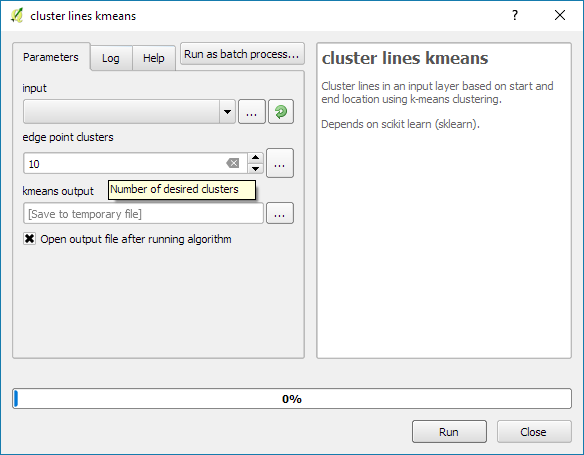
One approach to speed up computations is to first use a quick clustering algorithm and then perform edge bundling on each cluster individually. If done correctly, clustering significantly reduces the size of each compatibility matrix.
In this example, we divided the edges into six clusters before bundling them. If you compare this result to the visualization at the top of this post (which did not use clustering), you’ll see some differences here and there but, overall, the results are quite similar:

Looking at these examples, you’ll probably spot a couple of issues. There are many additional ideas for potential improvements from existing literature which we have not implemented yet. If you are interested in improving these tools, please go ahead! The code and more examples are available on Github.
For more details, leave your email in a comment below and I’ll gladly send you the pre-print of our paper.
This post is part of a series. Read more about movement data in GIS.

Thanks for sharing this analytic tool for visualizing directional, geospatial flows. Is there a demo project where I can learn how to properly use the tools you outline in this article?
Also, please send me a copy of the pre-print article 😀
There is no demo project yet but that’s a great idea! I’ll see what I can do.
Thank you for this, and all the other postings in the series. Can I request a copy of the paper please?
Graeme
Great post. I was so looking forward for a GIS-friendly implementation of edge bundling.
I am, however unable to run the script:
“No module named sklearn.cluster See log for more details”
It seems the code is calling “sklearn.cluster” but I’m unsure if this is part of numpy or mathpy
Any suggestion on how to solve?
Hi Daniel, I’ve added install instructions to the readme now: https://github.com/dts-ait/qgis-edge-bundling/blob/master/README.md
Hello, thank you for the post. Seems like a really useful and cool tool. I am trying to run it but i get these errors:
“Problem with OTB installation: installed OTB version (5.2.1) is not supported
Problem with SAGA installation: unsupported SAGA version found.
Cannot find variable: staticmethod”
Could you advise on which versions of Python and QGIS does this program running for? Thank you.
Dear Sunny, that looks like a general issue with the setup of your processing toolbox. Since our scripts don’t require either OTB nor SAGA, you could try to deactivate those providers on the processing settings. We developed using QGIS 2.18 and tested on Ubuntu and Windows.
Hello, thank you for your reply! I have deactivated the providers but those messages are still showing. I guess it might not be a problem since they not used.
Should I be able to see a visible difference after the edge bundling process? I am able to run the tool despite the error message “Cannot find variable: staticmethod” and it loads a new layer but it is exactly the same as the original.
I am new to running Python scripts in QGIS. Thank you for your assistance.
There should be a visible effect if the parameters you used were suitable for the dataset. It’s almost impossible to say what happened without access to your data and settings.
I’ve noticed that the error message “Cannot find variable: staticmethod” appears when the input data contains lines with zero length.
Does the input has be straight lines with only start and end point?
I tried with my GPS trajectories which are linestrings, it is not working.
Yes, input lines have to be straight lines consisting of start and end point only.
Hello – Really interesting implementation. We have been able to run the scripts on the sample data for New York, but we had to fudge the Coordinate Reference System – can you supply it? We are applying the scripts to our data for migration in Southern Ontario in the 19th century. Would appreciate having an advance print of the article. Thanks for sharing your work.
Actually just a added note – we are using QGIS 2.18 and the script rather than your QGIS 3.0 implementation. Cheers.
I’ve now added CRS information to the dataset description at https://github.com/dts-ait/qgis-edge-bundling/blob/master/sample_data/NYC_green_taxi_trips_sample.md and you should find a link to the article in your inbox.
Dear Anita,
Thank you very much for your article and plugin. I am however unable to run the script which return me the following error:
ModuleNotFoundError: No module named ‘processing_edgebundling’
Do you know how I could solve it? I am running qgis 3 on windows 10.
Thank you very much,
Iacopo
Dear Iacopo,
This sounds like the plugin is not installed correctly. Please try with this zip archive https://www.dropbox.com/s/s6qvv7r1zqxw7dy/processing_edgebundling.zip?dl=0 and install it using the Plugin Manager | Install from ZIP function.
Thank you very much! That solved the problem, both plugins run just fine now. I am howver experiencing another issue when trying to use the edge bundling plugin. When I try to bundle the lines, I get the following error:
…QGIS/QGIS3\profiles\default/python/plugins\processing_edgebundling\edgebundlingUtils.py”, line 190, in force_directed_eb
self.epm_x[e_idx, 0] = vertices[0].x()
IndexError: list index out of range
I am using bilateral trade flow data, around 3 thousands entries, which I mapped using the “Flow Mapper” plugin.
Thank you!
Please check if the data contains zero length lines.
Thank you for your answer, Anita. I had already deleted all the zero lenght lines, but unfortunately still receive that error message. This is one line of the kind of shapefile I am using
MultiLineString ((-64.07226599999999905 -32.87958700000000078, 105.35888699999999574 13.09017899999999912))
Those numbers are the coordinates of two points.
Thnak you!
It could be an issue with multipart geometries. Try using the Multipart to Singlepart tool.
Hi Anita,
Thanks again for your suggestions.
I tried to aggregate the flows by their magnitude and your script runs without any error now!
Nevertheless, the resulting layer looks a bit strange: the lines are not really bundled together, they are like fragmented into many “pieces”. Sorry if this sounds confusing, but it’s not easy to describe in words. Do you think this might depend on the SR I am using (WGS84) or something I should change in the “initial step size”?
Thanks again!!
Without a screenshot, I’ll have to make some educated guesses. Since your data is in WGS84, you will want to use a pretty small step size, definitely smaller than 1, maybe 0.01.
Anita, thank you so much! That solved the problem!! Thank you for all your suggestions and your patience, my map looks much better now.
Thanks again for this amazing plugin!
Iacopo