Movement data in GIS #10: open tools for AIS tracks from MarineCadastre.gov
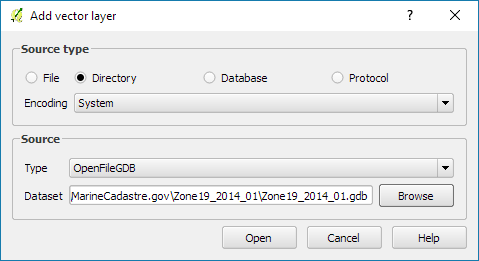
MarineCadastre.gov is a great source for AIS data along the US coast. Their data formats and tools though are less open. Luckily, GDAL – and therefore QGIS – can read ESRI File Geodatabases (.gdb).
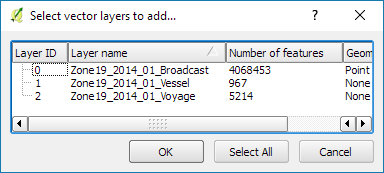
MarineCadastre.gov also offer a Track Builder script that creates lines out of the broadcast points. (It can also join additional information from the vessel and voyage layers.) We could reproduce the line creation step using tools such as Processing’s Point to path but this post will show how to create PostGIS trajectories instead.
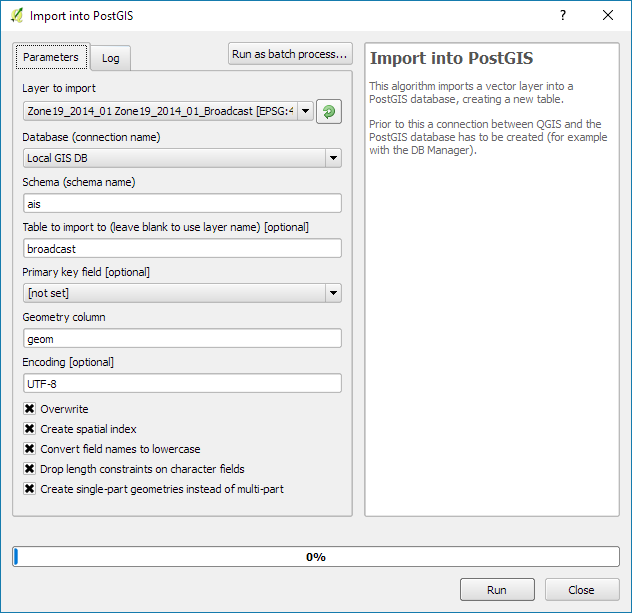
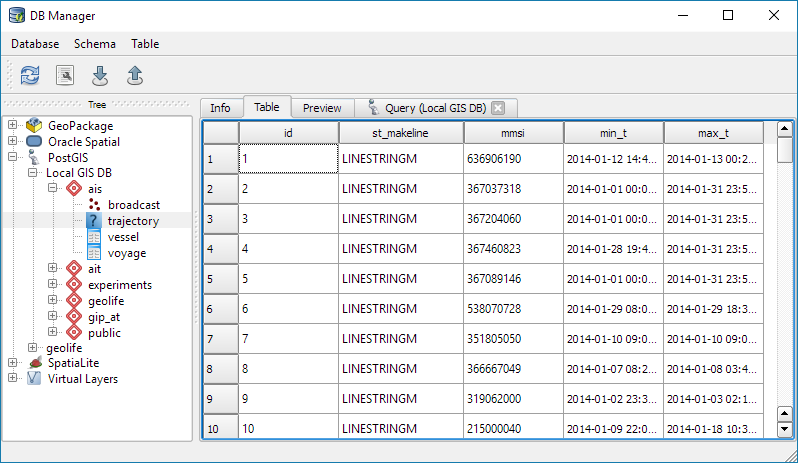
First, we have to import the points into PostGIS using either DB Manager or Processing’s Import into PostGIS tool:
Then we can create the trajectories. I’ve opted to create a materialized view:
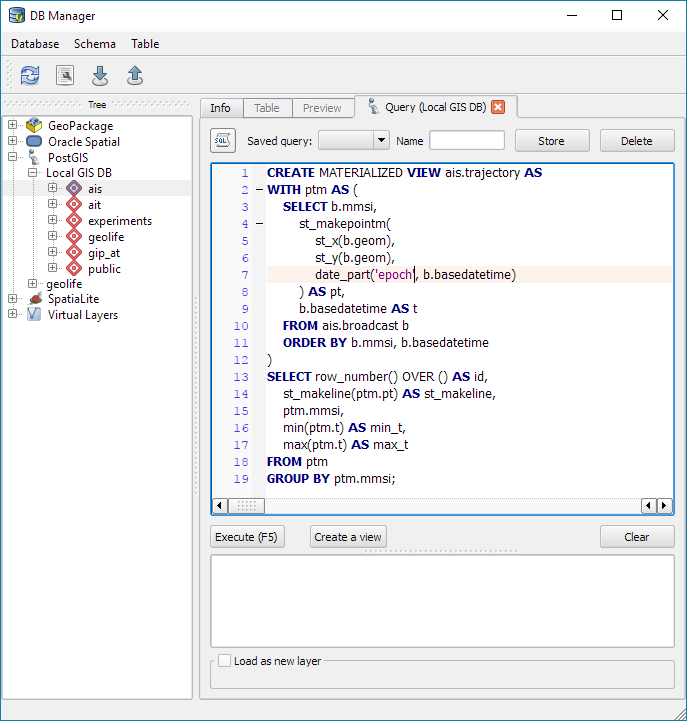
The first part of the query creates a temporary table called ptm (short for PointM). This step adds time stamp information to each point. The second part of the query then aggregates these PointMs into trajectories of type LineStringM.
CREATE MATERIALIZED VIEW ais.trajectory AS
 WITH ptm AS (
   SELECT b.mmsi,
     st_makepointm(
       st_x(b.geom),
       st_y(b.geom),
       date_part('epoch', b.basedatetime)
     ) AS pt,
     b.basedatetime t
   FROM ais.broadcast b
   ORDER BY mmsi, basedatetime
 )
 SELECT row_number() OVER () AS id,
   st_makeline(ptm.pt) AS st_makeline,
   ptm.mmsi,
   min(ptm.t) AS min_t,
   max(ptm.t) AS max_t
 FROM ptm
 GROUP BY ptm.mmsi
WITH DATA;
The trajectory start and end times (min_t and max_t) are optional but they can help speed up future queries.
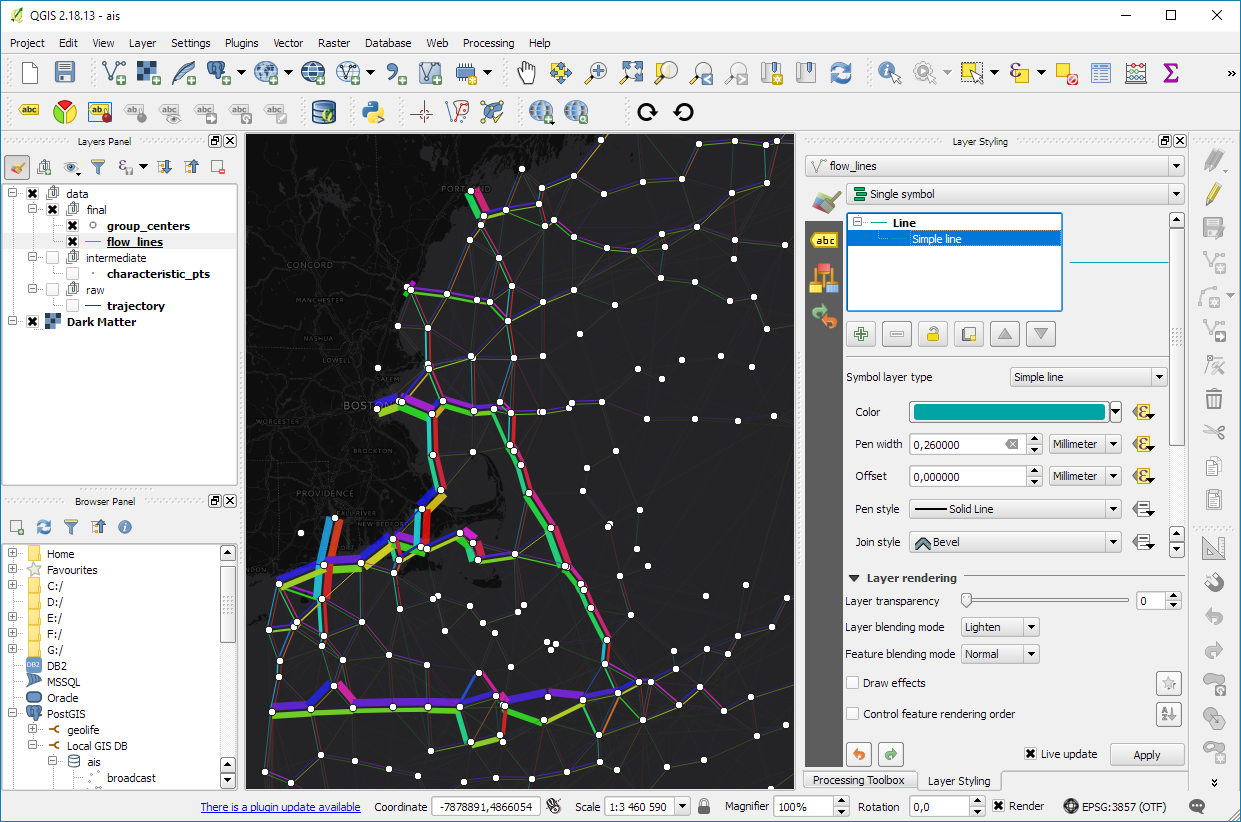
One of the advantages of creating trajectory lines is that they render many times faster than the original points.

Of course, we end up with some artifacts at the border of the dataset extent. (Files are split by UTM zone.) Trajectories connect the last known position before the vessel left the observed area with the position of reentry. This results, for example, in vertical lines which you can see in the bottom left corner of the above screenshot.
With the trajectories ready, we can go ahead and start exploring the dataset. For example, we can visualize trajectory speed and/or create animations:

Purple trajectory segments are slow while green segments are faster
We can also perform trajectory analysis, such as trajectory generalization:
This is a first proof of concept. It would be great to have a script that automatically fetches the datasets for a specified time frame and list of UTM zones and loads them into PostGIS for further processing. In addition, it would be great to also make use of the information in the vessel and voyage tables, thus splitting up trajectories into individual voyages.
This post is part of a series. Read more about movement data in GIS.

This is really excellent. Is it possible to do this using SpatiaLite instead of PostGIS? Many users in a professional enterprise environment do not have rights to install PostGIS, and have to settle for a file based solution.
For example, I have available to me a full Esri stack, MSSQL +Spatial, and QGIS on the side. I’m trying to implement more work flows like this in QGIS, but not having PostGIS is a reality that I and many have to deal with.
I’m not sure if SpatiaLite provides all the functionality used in this example. You might want to look into PortableGIS https://portablegis.xyz/post/about/ which provides PostGIS without the need to install anything.
For users without the ability to install postgis as a service and who need postgis features, there is a python module that starts postgrs/gis as a simple user (https://github.com/Oslandia/pglite). The “server” is started e.g. at qgis startup and it uses a user directory for all it’s files (cluster).
There are (unofficial) osgeo4w packages for potgres, postgis and pglite here http://osgeo4w-oslandia.com/extra/
Warning: it’s still somewhat on the rough side.
Anita, Thank you for sharing — would you be able to utilize this script — or one like it in ESRI’s ArcGIS?
MarineCadastre.gov’s data preprocessing tools are for ArcGIS. I’m not aware if you could achieve similar visualization/animation results. The trajectory generalization script would have to be adapted to ArcPy.
Thank you, Underdark. So the real question is: would the ArcPy-adapted trajectory generalization script–using the ArcGIS data processing tools–produce the same type of visualization and accurate vessel trajectory analysis seen in the picture in Anita’s blog within ArcGIS? And if so, can we adapt the script even further to obtain more predictory analysis of vessel movement?
It’s safe to assume that the trajectory generalization script can be successfully ported to ArcGIS given adequate developer resources. Beyond that, the generalization methodology implemented here does not attempt to provide predictions. There are more promising prediction approaches in the relevant literature.
This is exactly what I have been looking for – I am a beginner to GIS but use AIS data a lot. I followed your process with one vessel and got a “nearly good” result. At seemingly random data points the trajectory shoots off in a nor’west direction and then returns at the next data point. Can I send you a screen shot?
Please ignore this request. I found the problem – 0 lat and long in the offending records! Keep up the great work!