Archive

Author Archives: underdark

In Publishing interactive web maps using QGIS, I presented two plugins for exporting web maps from QGIS. Today, I want to add an new member to this family: the qgis2web plugin is the successor of qgis-ol3 and combines exports to both OpenLayers3 as well as Leaflet.

The plugin is under active development and currently not all features are supported for both OpenLayers3 and Leaflet, but it’s a very convenient way to kick-off a quick webmapping project.

Here’s an example of an OpenLayers3 preview with enabled popups:

OpenLayers3 preview

OpenLayers3 preview

And here is the same map in Leaflet with the added bonus of a nice address search bar which can be added automatically as well:
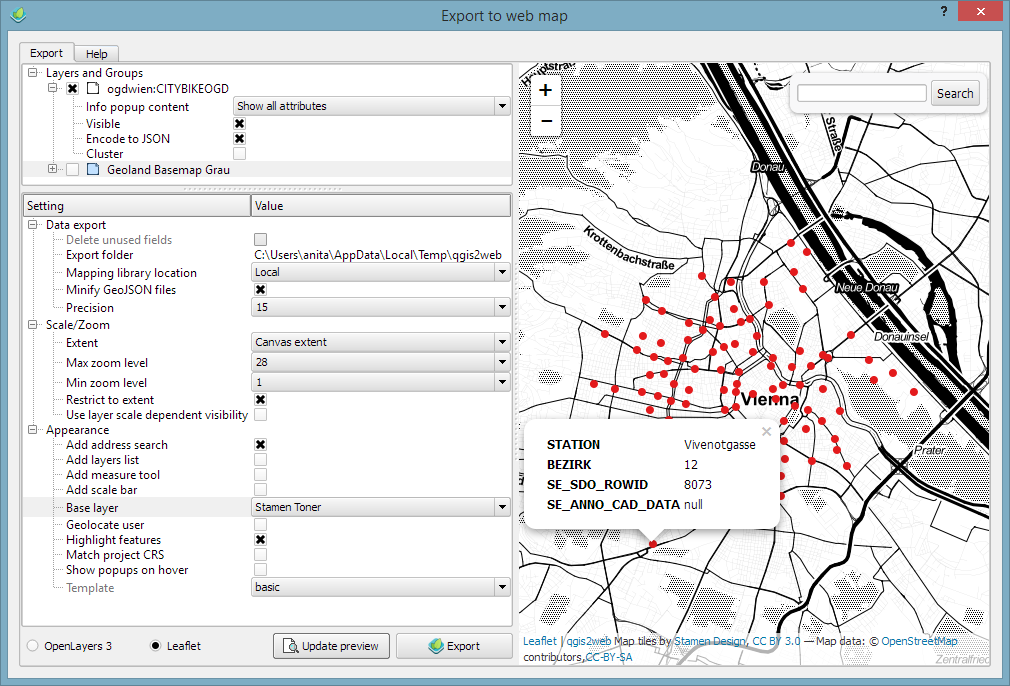
Leaflet preview

Leaflet preview

The workflow is really straight forward: select the desired layers and popup settings, pick some appearance extras, and then don’t forget to hit the Update preview button otherwise you might be wondering why nothing happens ;)

I’ll continue testing these plugins and am looking forward to seeing what features the future will bring.

Granted, I could only follow FOSS4G 2015 remotely on social media but what I saw was quite impressive and will keep me busy exploring for quite a while. Here’s my personal pick of this year’s highlights which I’d like to share with you:

QGIS

Marco Hugentobler at FOSS4G 2015 (Photo by Jody Garnett)

Marco Hugentobler at FOSS4G 2015 (Photo by Jody Garnett)

The Sourcepole team has been particularly busy with four presentations which you can find on their blog.

Marco Hugentobler’s keynote is just great, summing up the history of the QGIS project and discussing success factor for open source projects.

Marco also gave a second presentation on new QGIS features for power users, including live layer effects, new geometry support (curves!), and geometry checker.

There has also been an update to QTiles plugin by NextGIS this week.

If you’re a bit more into webmapping, Victor Olaya presented the Web App Builder he’s been developing at Boundless. Web App Builder should appear in the official plugin repo soon.

Preview of Web App Builder from Victors presentation

Preview of Web App Builder from Victors presentation

Geocoding

If you work with messy, real-world data, you’ve most certainly been fighting with geocoding services, trying to make the best of a bunch of address lists. The Python Geocoder library promises to make dealing with geocoding services such as Google, Bing, OSM & many easier than ever before.

Let me know if you tried it.

Mobmap Visualizations

Mobmap – or more specifically Mobmap2 – is an extension for Chrome which offers visualization and analysis capabilities for trajectory data. I haven’t tried it yet but their presentation certainly looks very interesting:

We are celebrating FOSS4G 2015 in Seoul with great open source GIS book discounts at both Packt and Locate Press. So if you don’t have a copy of “Learning QGIS”, “The PyQGIS Programmer’s Guide”, or “Geospatial Power Tools” yet, check out the following sites:

2

This is a follow-up on my previous post introducing an Open source IDF parser for QGIS. Today’s post takes the code further and adds routing functionality for foot, bike, and car routes including oneway streets and turn restrictions.

You can find the script in my QGIS-resources repository on Github. It creates an IDFRouter object based on an IDF file which you can use to compute routes.

The following screenshot shows an example car route in Vienna which gets quite complex due to driving restrictions. The dark blue line is computed by my script on GIP data while the light blue line is the route from OpenRouteService.org (via the OSM route plugin) on OSM data. Minor route geometry differences are due to slight differences in the network link geometries.

Screenshot 2015-08-01 16.29.57

IDF is the data format used by Austrian authorities to publish the official open government street graph. It’s basically a text file describing network nodes, links, and permissions for different modes of transport.

Since, to my knowledge, there hasn’t been any open source IDF parser available so far, I’ve started to write my own using PyQGIS. You can find the script which is meant to be run in the QGIS Python console in my Github QGIS-resources repo.

I haven’t implemented all details yet but it successfully parses nodes and links from the two example IDF files that have been published so far as can be seen in the following screenshot which shows the Klagenfurt example data:

Screenshot 2015-07-23 16.23.25

If you are interested in advancing this project, just get in touch here or on Github.

If you follow my blog, you’ve most certainly seen the post How to create illuminated contours, Tanaka-style from earlier this year. As Victor Olaya noted correctly in the comments, the workflow to create this effect lends itself perfectly to being automated with a Processing model.

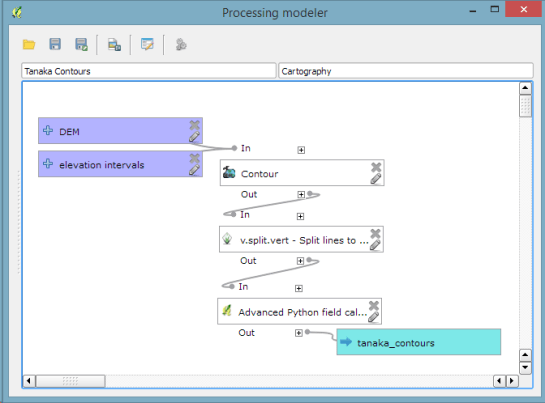
The model needs only two inputs: the digital elevation model raster and the interval at which we want the contours to be created:

Screenshot 2015-07-05 18.59.34

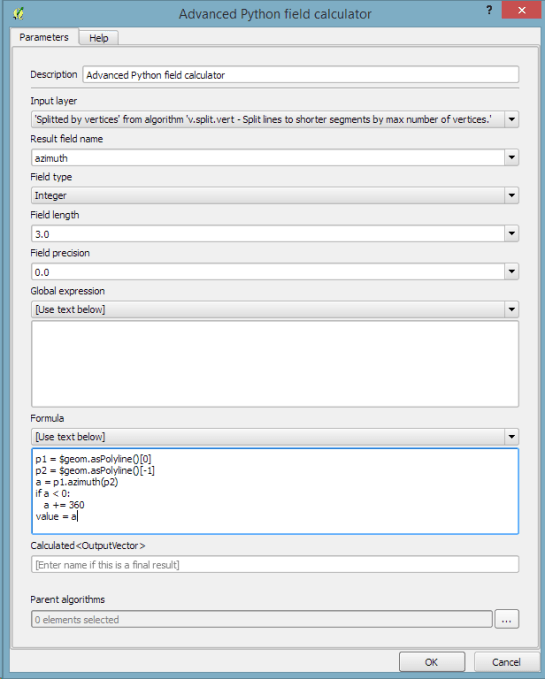
The model steps are straightforward: the contours are generated and split into short segments before the segment orientation is computed using the following code in the Advanced Python Field Calculator:

p1 = $geom.asPolyline()[0]
p2 = $geom.asPolyline()[-1]
a = p1.azimuth(p2)
if a < 0:
   a += 360
value = a

Screenshot 2015-07-05 18.53.26

You can find the finished model on Github. Happy QGISing!

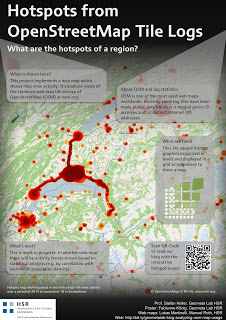
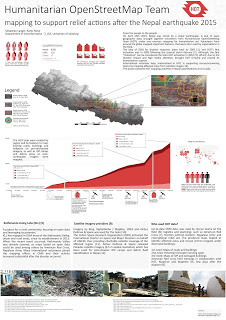
It’s my pleasure to report back from this year’s AGIT and GI_Forum conference (German and English speaking respectively). It was great to meet the gathered GIS crowd! If you missed it, don’t despair: I’ve compiled a personal summary on Storify, and papers (German, English) and posters are available online. Here’s a pick of my favorite posters:

I also had the pleasure to be involved in multiple presentations this year:

QGIS at the OSGeo Day

As part of the OSGeo Day, I had the chance to present the latest and greatest QGIS features for map design in front of a full house:

Routing with OSM

On a slightly different note, my colleague Markus Straub and I presented an introduction to routing with OpenStreetMap covering which kind of routing-related information is available in OSM as well as a selection of different tools to perform routing on OSM.

Solving the “unnamed link” problem

In this talk, I presented approaches to solving issues with route descriptions that contain unnamed pedestrian or cycle paths.

Here you can find the full open access paper: Graser, A., & Straub, M. (2015). Improving Navigation: Automated Name Extraction for Separately Mapped Pedestrian and Cycle Links. GI_Forum ‒ Journal for Geographic Information Science, 1-2015, 546-556, doi:10.1553/giscience2015s546.

Inferring road popularity from GPS trajectories

In this talk, my colleague Markus Straub presented our new approach to computing how popular a certain road is. The resulting popularity value can be used for planning as well as routing.

https://twitter.com/underdarkGIS/status/618690617556795392

Here you can find the full open access paper: Straub, M., & Graser, A. (2015). Learning from Experts: Inferring Road Popularity from GPS Trajectories. GI_Forum ‒ Journal for Geographic Information Science, 1-2015, 41-50, doi:10.1553/giscience2015s41.

If you are following QGIS on Twitter you’ve probably noticed the increasing number of tweets by journalists using QGIS.

For example this map in the Financial Times by Hannah Dormido

or this one with overview maps and three different levels of details

or this map with semi-transparent label backgrounds and nice flag images

or even Time Manager animations by raoulranoa in the Los Angeles Times

https://twitter.com/ranoa/status/616668385036902401

I think this is a great development and a sign of how wide-spread QGIS usage is today.

If you know of any other examples or if you are a journalist using QGIS yourself, I’d love to see more!

Do you like the QGIS heatmap functionality? Did you know that QGIS can also create animated heatmaps?

The following video tutorial shows all necessary steps. To reproduce it, you can get the sample data from my Time Manager workshop at #QGIS2015.

With the release of 2.10 right around the corner, it’s time to have a look at the new features this version of QGIS will bring. One area which has received a lot of development attention is layer styling. In particular, I want to point out the following new features:

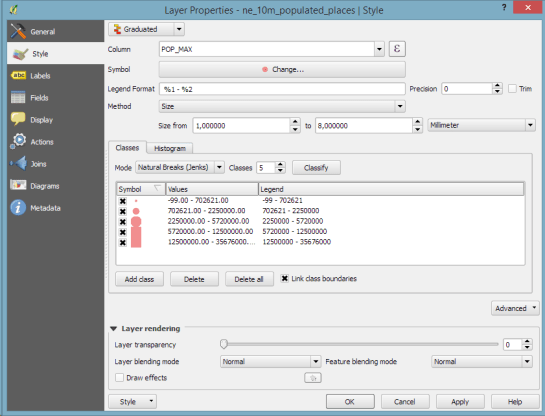
1. Graduated symbol size

The graduated renderer has been expanded. Formerly, only color-graduated symbols could be created automatically. Now, it is possible to choose between color and size-graduated styles:

Screenshot 2015-06-21 18.39.25

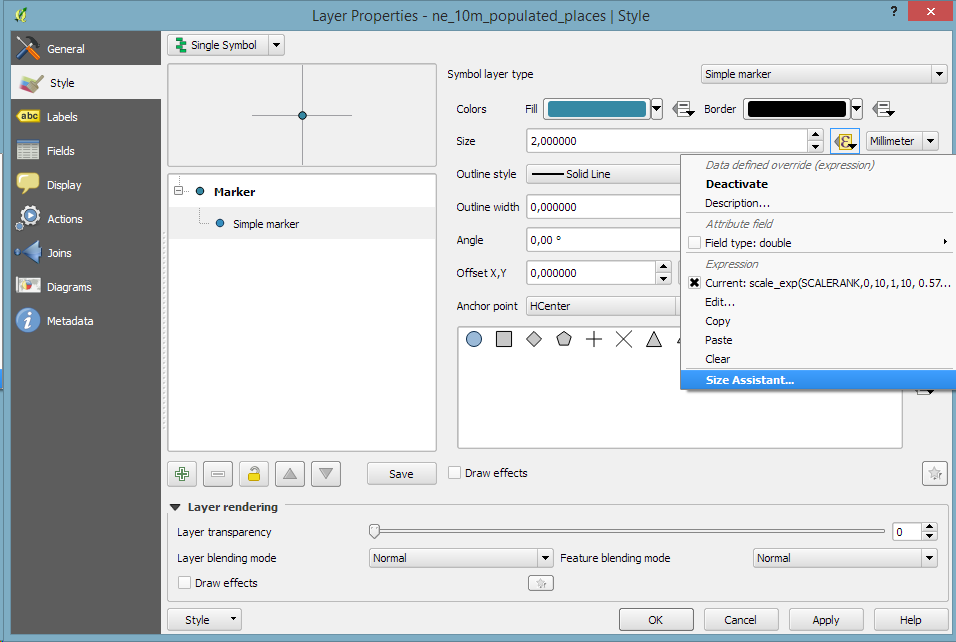
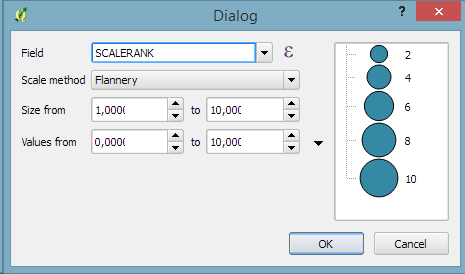
2. Symbol size assistant

On a similar note, I’m sure you’ll enjoy the size assistant for data-defined size:

Screenshot 2015-06-21 23.16.10 Screenshot 2015-06-21 23.16.01

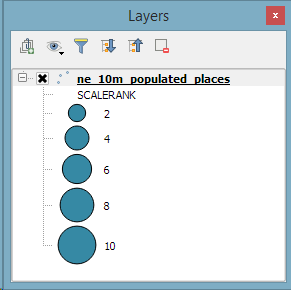
What’s particularly great about this feature is that it also creates a proper legend for the data-defined sizes:

Screenshot 2015-06-21 23.18.46

3. Interactive class exploration and definition

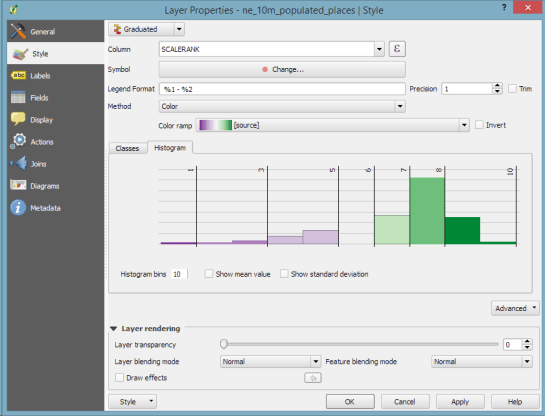
Another great addition to the graduated renderer dialog is the histogram tab which visualizes the distribution of values as well as the defined class borders. Additionally, the user can interactively change the classes by moving the class borders:

Screenshot 2015-06-21 18.43.09

4. Live layer effects

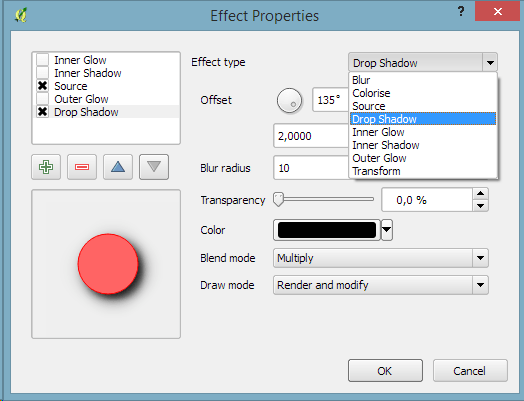
Since Nyall’s crowd funding initiative for live layer effects was a resounding success, it is now possible to create amazing effects for your vector styles such as shadows, glow, and blur effects:

Screenshot 2015-06-21 18.45.22

I’m very much looking forward to seeing all the new map designs this enables on the QGIS map Flickr group.

Thanks to everyone who was involved in developing and funding these new features!